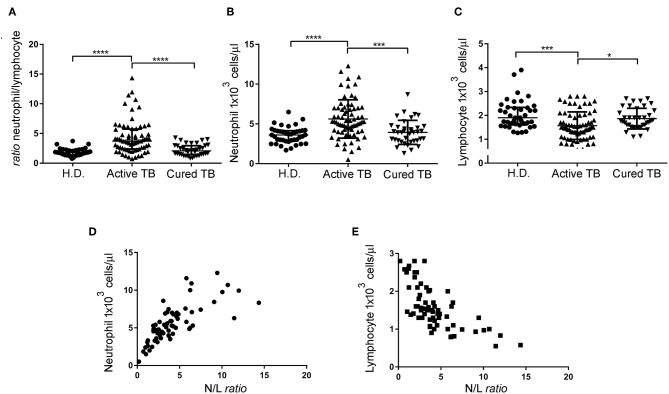
Figure 1.
N/L ratio, neutrophil, and lymphocyte absolute count of the different cohort groups and correlation between the N/L ratio and absolute neutrophil and lymphocyte count. N/L ratio (A), neutrophil absolute count (B), and lymphocyte absolute count (C) of patients with active TB disease, cured TB patients, and H.D. Each dot represents the value of an individual subject. Each horizontal bar represents the median of each group. (D) Correlation between the N/L ratio and absolute neutrophil count, analyzed by Spearman rank correlation test. Data shown are the values of each individual subject. (E) Correlation between the N/L ratio and absolute lymphocyte count analyzed by Spearman rank correlation test. Data shown are the values of each individual subject. Significance of differences between groups was compared using Kruskal-Wallis test, *p < 0.05, ***p < 0.001, ****p < 0.0001.

