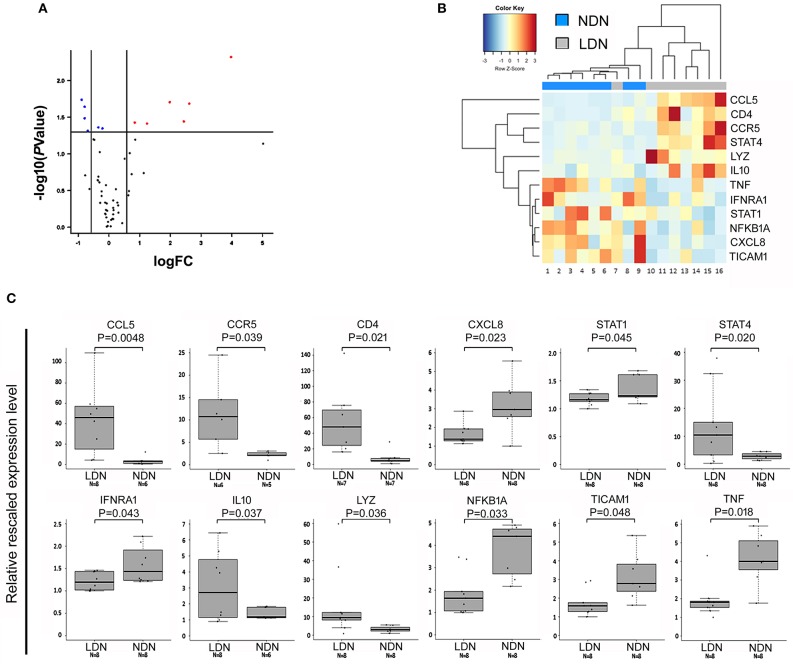
Figure 4.
Genes differentially expressed in NDNs and LDNs of TB patients. (A) Volcano plot representing genes differentially expressed between LDN and NDN groups. Red and blue dots indicate significantly up- and down-regulated genes, respectively. FC, fold change. (B) Heat map representing the dysregulated genes between NDNs and LDNs of TB patients. Normalized median-centered expression values were used. Red and blue color intensities indicate up-regulation and down-regulation, respectively. The dendrogram clustering on the X-axis indicates sample similarity, whereas the dendrogram clustering on the Y-axis groups genes with similar expression profiles. Colored bars on the X-axis correspond to NDN and LDN groups. (C) Boxplots show expression levels of the 12 genes resulted significantly dysregulated in NDNs and LDNs of TB patients. Measurements were performed by semi-quantitative real-time RT-PCR assays (using the RT2 Profiler PCR Arrays). Boxes define the interquartile range; the thick line refers to the median. Results were normalized to expression levels of ACTB and B2M housekeeping genes and are presented as rescaled values. The number of subjects belonging to each group is indicated (N). Significance levels were calculated by the RT2 Profiler PCR Array Qiagen data analysis software.

