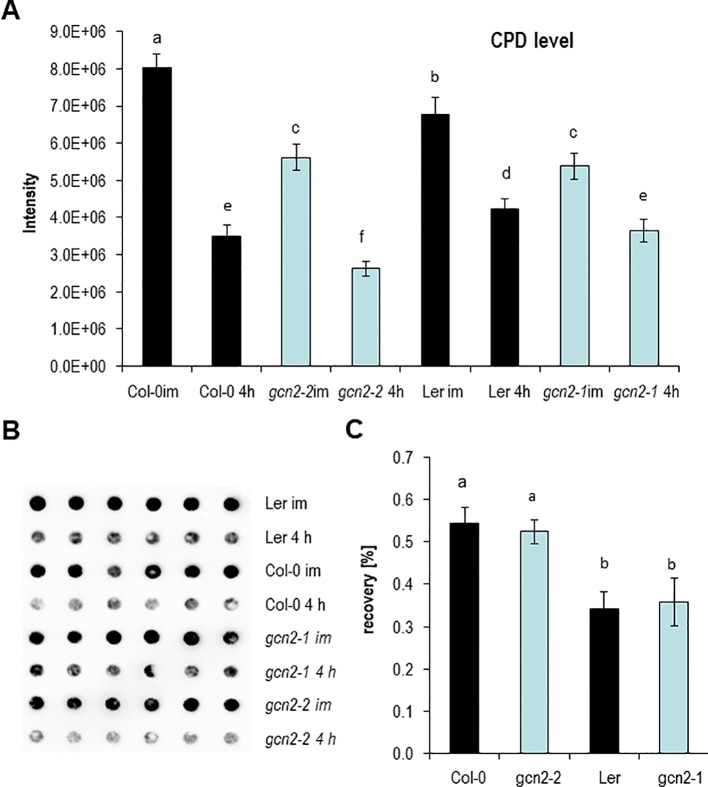
Figure 4.
DNA damage and repair analysis. (A) Absolute CPD levels of plants harvested immediately after 1 h UV-B exposure and 4 h after UV-B shut down. (B) Representative image of a genomic DNA dot blot hybridized with anti-CPD antibodies. (C) Calculated recovery after UV-B exposure. Graphs represents means and ± SE of three to five experiments (six dots per experiment). Letters indicate the significant differences.

