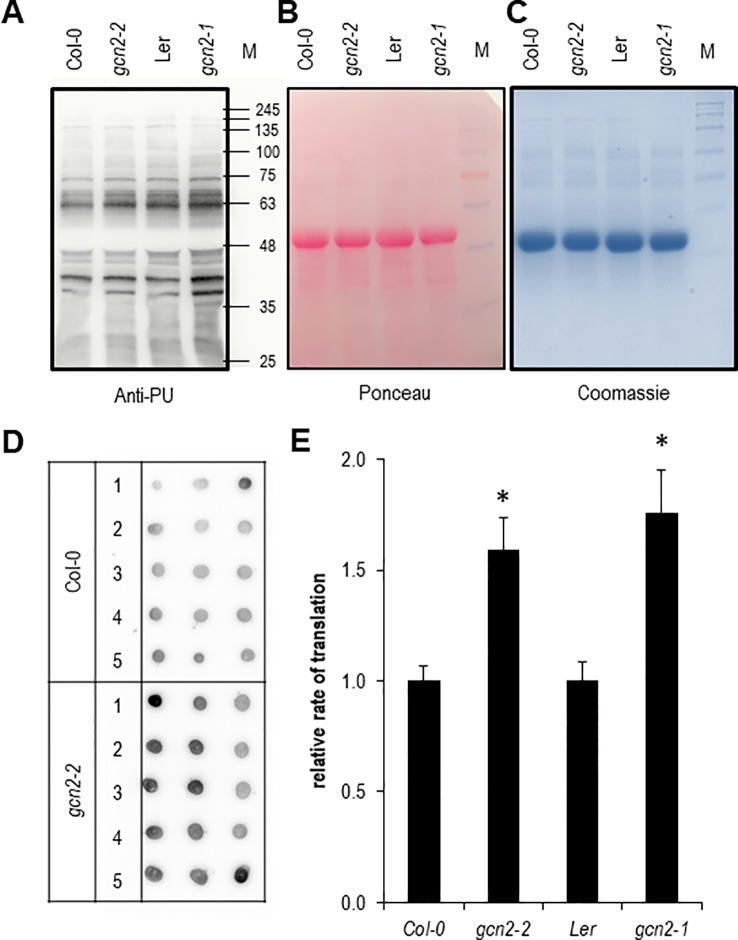
Figure 5.
Quantification of the rate of protein biosynthesis using puromycin (PU) (A) Anti-PU Western blot with wildtype and gcn2 mutants. To confirm equal loading of the 10% sodium dodecyl sulfate polyacrylamide gel electrophoresis, the membrane was stained with (B) Ponceau S and (C) Coomassie. (D) Example of a dot blot analysis with total protein extracts of PU treated seedlings where PU incorporation was detected with anti-PU antibodies. (E) Quantification of the dot blot analyses. Bars represent means and SE of at least 15 dots per experiment. Data of Col-0 and gcn2-2 are means of three independent experiments, data from Ler and gcn2-1 from a single experiment. Stars indicate significant differences (p < 0.05) between wildtype and mutants calculated with Student’s t- test. M designates the protein size marker line.

