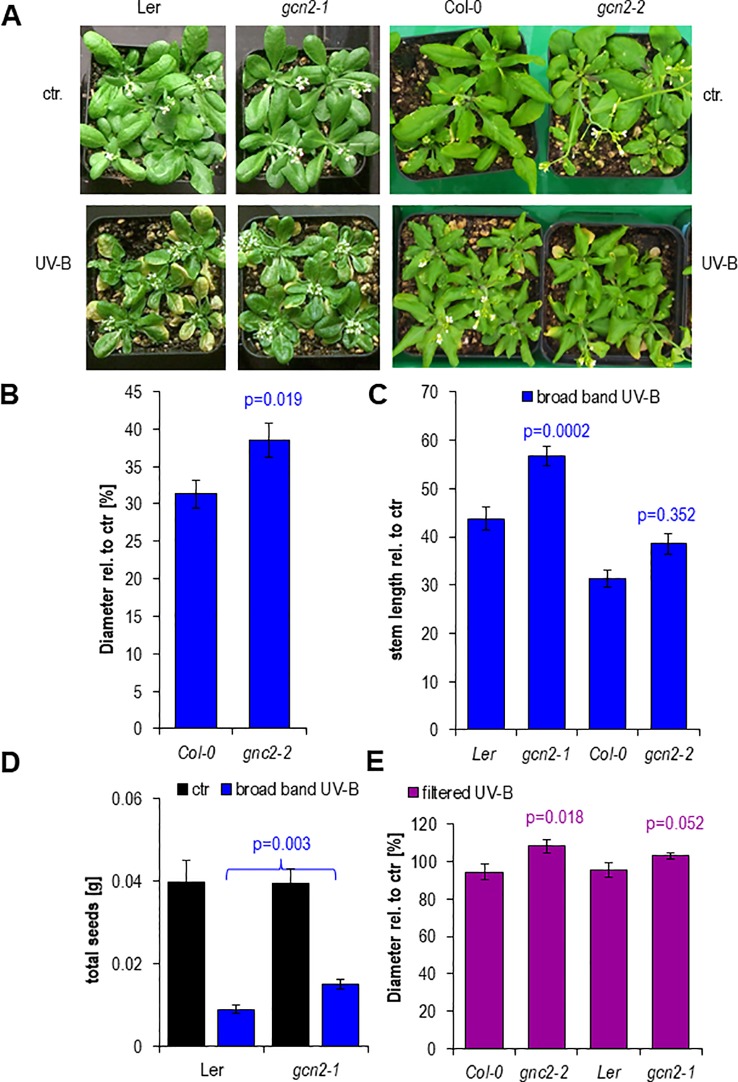
Figure 7.
Phenotypes after 15 days of chronic UV-B exposure. (A) Rosettes of wildtype and gcn2 mutants after a 1 h daily dose with 6 µmol m-2 s-1 UV-B broad band UV-B. (B) Quantification of rosette diameters of 18 to 21 plants. (C) Quantification of the stem lengths of 9 to 20 plants. (D) Quantification of the total seed weight of 9 to 19 plants. (E) Quantification of rosette diameter under chronic filtered broad band UV-B of 10 to 25 plants. Bars represent means and SE. Statistical differences between wildtype and mutants were calculated with Student’s t- test and p-values are indicated above each bar. Numbers of plants are designated in the respective bars.

