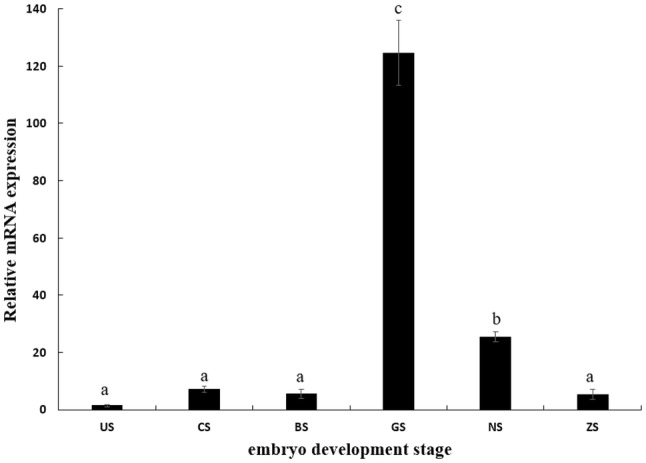
Fig. 4.

Transcriptional profile of MnSoxE1 during embryonic development. US unfertilized stage, CS cleavage stage, BS blastula stage, GS gastrula stage, NS nauplius stage, ZS zoea stage. Different letters denote significant differences (P < 0.05). Error bars represent the mean ± standard error
