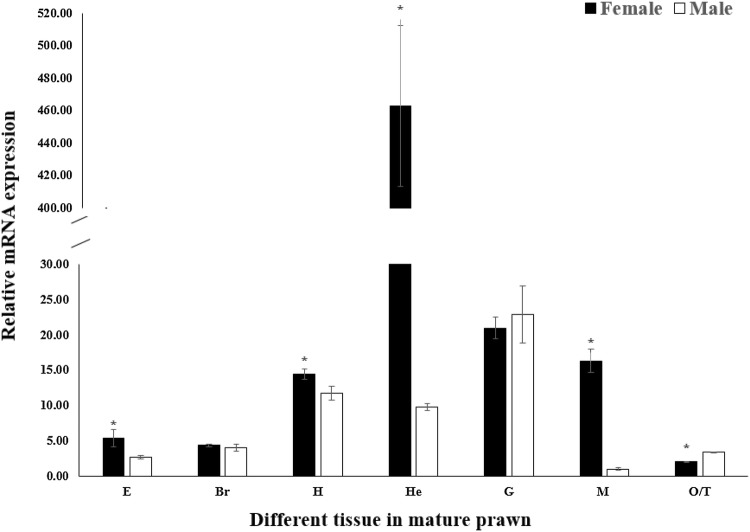
Fig. 7.
The expression profile of MnSoxE1 in different tissues was revealed by real-time quantitative PCR. The amount of MnSoxE1 mRNA was normalized to the MnEIF transcript level. Data are shown as mean ± SD of three replicates in various tissues. E eyestalk, Br brain; H heart, He hepatopancreas, G gill, M muscle, O ovary, T testis. Data indicated with asterisks are significantly different between different groups (P < 0.05). Error bars represent the mean ± standard error

