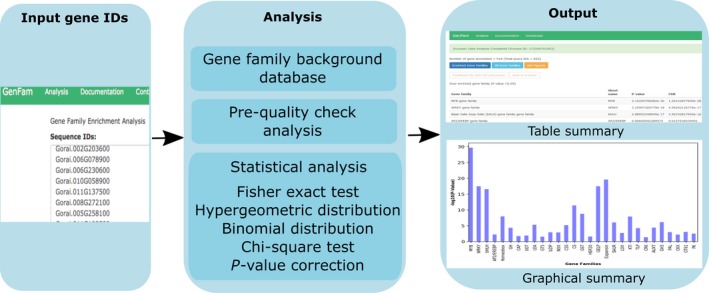
Figure 1.

GenFam workflow. The list of input gene IDs for respective plant species provided by the user is analyzed for enrichment analysis using various statistical tests. The output of the analysis can be viewed and/or downloaded as a table and/or graphical summary. The results page has multiple options to visualize or download data for both enriched and non‐enriched categories (all gene families). The detailed output data from case studies are provided in Tables S3, S4, S5, and S6
