
Figure 2.
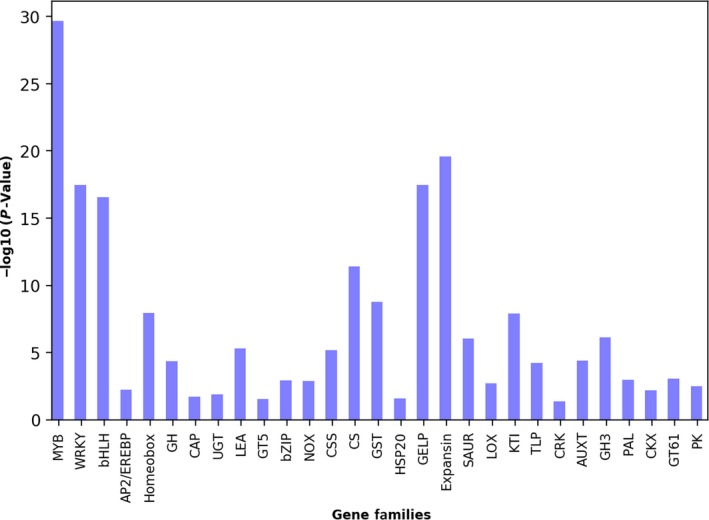
Graphical summary of GenFam enrichment analysis of a cotton case study. Results are plotted as bar chart using the −log10(p‐value) scores. Higher the −log10(p‐value) value, greater the confidence in enrichment of the gene family
Official websites use .gov
A
.gov website belongs to an official
government organization in the United States.
Secure .gov websites use HTTPS
A lock (
) or https:// means you've safely
connected to the .gov website. Share sensitive
information only on official, secure websites.
Graphical summary of GenFam enrichment analysis of a cotton case study. Results are plotted as bar chart using the −log10(p‐value) scores. Higher the −log10(p‐value) value, greater the confidence in enrichment of the gene family