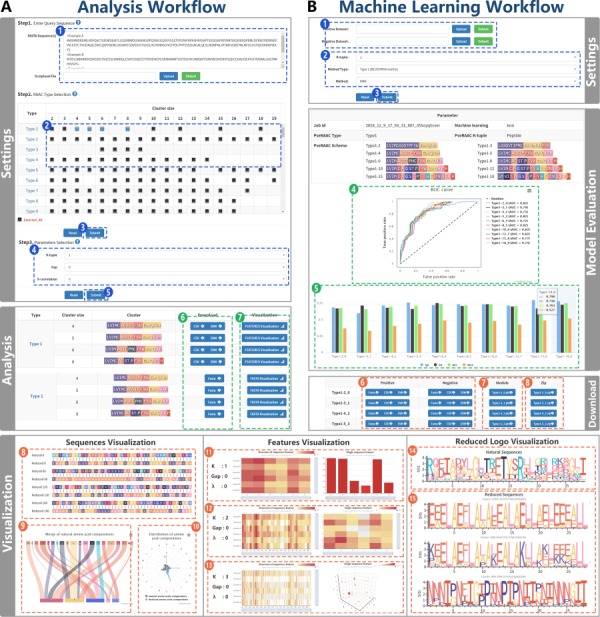
Figure 3.

RAACBook analysis and machine learning workflow. Subfigure (A) The workflow shows the reduction analysis of natural amino acid sequence. Settings pane: After uploading primary sequences in fasta format (Step 1) and the alphabet types of interest were used as input (Step 2). If only these parameters are submitted, the server can generate reduced sequence files (Step 3). If the aim is to produce sequence feature files for machine learning, users need to select three parameters (Step 4) and submit (Step 5). Analysis panel: there are three files for download (Step 6). The reduced amino acid sequences are visualized by clicking ‘Visualization’ button (Step 7). Sequences visualization: three charts were exhibited: alignment between natural and reduced amino acid sequences (Step 8), mergence of natural amino acid composition (Step 9), and distribution of amino acid composition (Step 10). Features visualization (Steps 11–13): according to different reduced alphabets and parameters, service will generate the K-tuple reduced amino acid composition heat map of multiple sequences and the distribution of single reduced sequence peptides. Reduced logo visualization (Steps 14–15): the figure represents each amino acid information of each position in protein sequence based on the reduced alphabet. Subfigure (B) Machine learning workflow shows the acquisition of the classifier model by uploading datasets and setting parameters. Settings panel (Steps 1–3): K-tuple, the alphabet type and the machine learning algorithm are selected (Step 2), after uploading fasta files containing positive and negative datasets (Step 1). Subsequently, the machine learning service was executed (Step 3). Model evaluation: the chart of Sp, Sn, Acc, Mcc and the diagram of the ROC curve are generated (Steps 4 and 5), and the classifier model and vector files can be downloaded (Steps 6–8).
