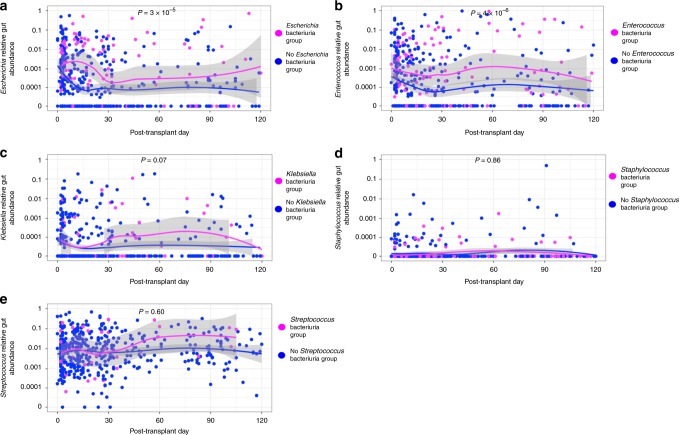
Fig. 1.
Temporal dynamics of relative gut abundances and respective bacteriuria. The relative gut abundance of bacteria is on the y-axis (logarithmic scale) and the post-transplant days stool specimens were collected are on the x-axis. The 510 specimens are each represented by a magenta-colored point reflecting a specimen belonging to the respective Bacteriuria Group and a blue-colored point reflecting the respective No Bacteriuria Group. LOESS curves with 95% confidence intervals (in gray) were created by group status. Comparison of relative gut abundances by group status was performed using a Wilcoxon rank sum test. a Temporal dynamics of Escherichia relative gut abundance following kidney transplantation by Escherichia Bacteriuria Group status. b Temporal dynamics of Enterococcus relative gut abundance following kidney transplantation by Enterococcus Bacteriuria Group status. c Temporal dynamics of Klebsiella relative gut abundance following kidney transplantation by Klebsiella Bacteriuria Group status. d Temporal dynamics of Staphylococcus relative gut abundance following kidney transplantation by Staphylococcus Bacteriuria Group status. e Temporal dynamics of Streptococcus relative gut abundance following kidney transplantation by Streptococcus Bacteriuria Group status. Source data are provided as a source data file.

