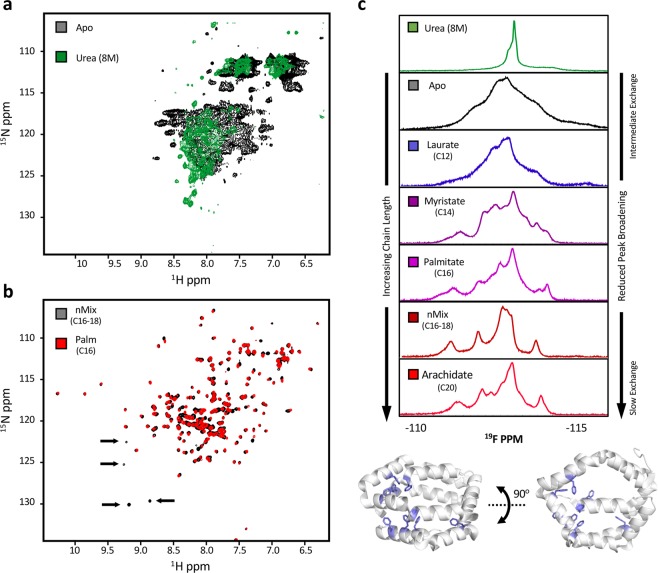
Figure 3.
Examining Bla g 1 Dynamics Using NMR. 1H-15N-NMR spectra of Apo-Bla g 1 in the absence (Black) or presence (Green) of 8 M urea (a) showing significant peak broadening indicative of intermediate (μs-ms) exchange dynamics. Spectra of Bla g 1 loaded with nMix (Black) or palmitate (Red) fatty-acid cargoes is shown in (b). Arrows indicate some of the peaks which experience broadening in the C16 sample relative to nMix. 19F-NMR spectra obtained for 3-fluorophenylalanine-labeled Bla g 1 in the absence and presence of various fatty-acid cargoes (c) showing the dependence on peak broadening on cargo acyl chain length. Spectra of denatured Bla g 1 in 8 M urea is shown for comparison (Green). Structure of Bla g 1 illustrating the location of all phenylalanine residues (Blue) is shown at bottom. PDB ID: 4JRB

