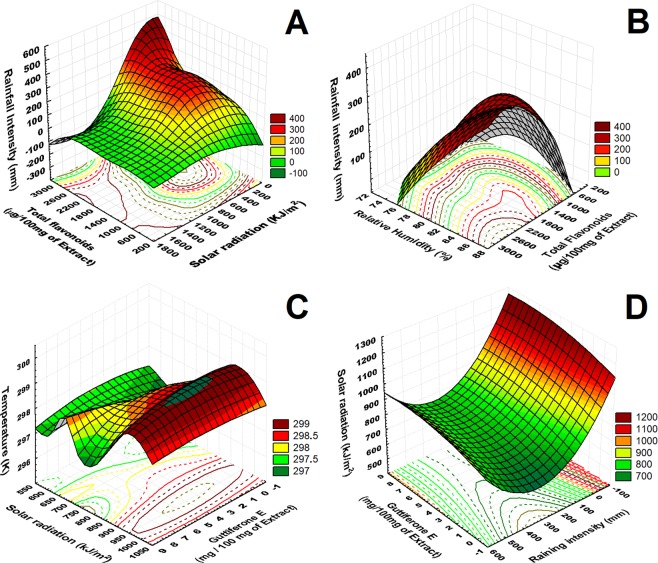
Figure 2.
Correlation on the 3D surface graphs (XYZ) between phenolic compounds concentration and meteorological data. (A) flavonoids concentration in µg/100 mg of propolis extract (X) versus rainfall intensity in mm (Y) and solar radiation (Z). (B) flavonoids concentration µg/100 mg of propolis extract (X) versus rainfall intensity (Y) and relative humidity (Z). (C) Guttiferone E concentration µg/100 mg of propolis extract (X) versus temperature in Kelvin (Y) and solar radiation (Z). (D) Guttiferones E concentration µg/100 mg of propolis extract (X) versus solar radiation in kJ.m2 (Y) and rainfall intensity in mm (Z).

