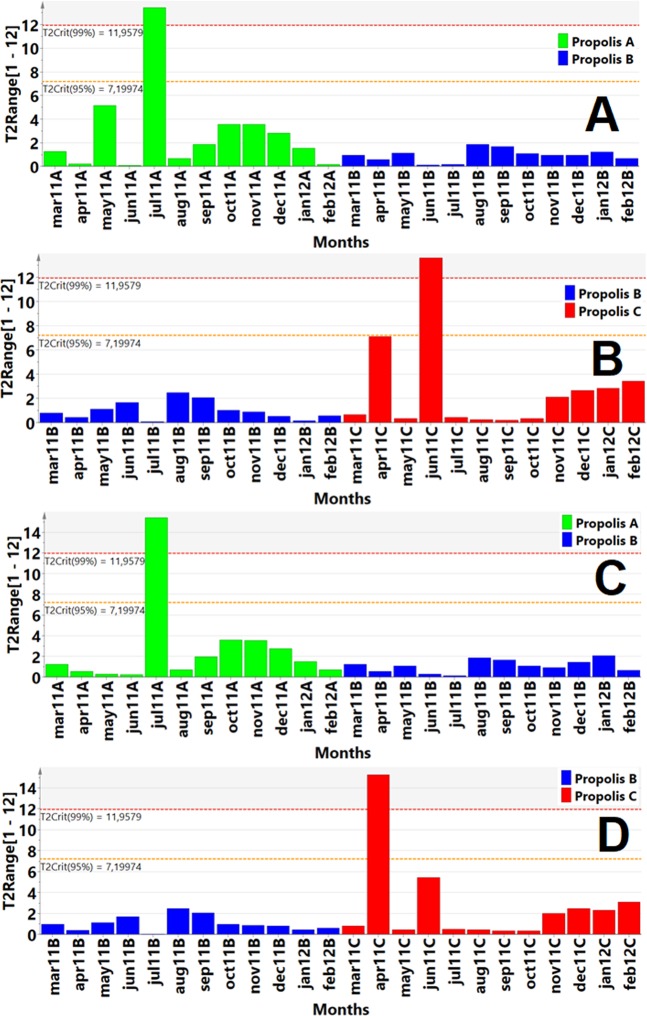
Figure 4.
PLS-DA analysis from the interaction between all components (Component 1, all months of the seasonal study as primary variable), (Components 2 to 5, phenolic compounds concentrations and Components 6 to 12, antibacterial activity concentrations tested as independent variables) were analysed using S. aureus (A,B) and P. aeruginosa (C,D). (A) Paired PLS-DA Hotelling´s T2 test compares propolis A (green) with propolis B (blue) at significant levels 95% (T2: 7.19) and 99%(T2: 11.95) as upper critical limits (UCL) in the antibacterial test against Staphylococcus aureus resulting in outliers in propolis A (July sample). The PLS-DA model was validated by CV-ANOVA, p = 0.0005, F = 8.16. (B) Paired PLS-DA Hotelling´s T2 test compares propolis B (blue) with propolis C (red) at significant levels 95% (T2: 7.19) and 99% (T2: 11.95) as upper critical limits (UCL) in the antibacterial test against Staphylococcus aureus resulting in outliers in propolis C (June sample). The PLS-DA model was validated by CV-ANOVA, p = 0.0199, F = 3.78. (C) Paired PLS-DA Hotelling´s T2 test compares propolis A (green) with propolis B (blue) at significant levels 95% (T2: 7.19) and 99% (T2: 11.95) as upper critical limits (UCL) in the antibacterial test against Pseudomonas aeruginosa resulting in outliers in propolis A (July sample). The PLS-DA model was validated by CV-ANOVA, p = 0.0002, F = 9.20. (D) Paired PLS-DA Hotelling´s T2 test compares propolis B (blue) with propolis C (red) at significant levels 95% (T2: 7.19) and 99% (T2: 11.95) as upper critical limits (UCL) in the antibacterial test against Pseudomonas aeruginosa resulting in outliers in propolis C (April sample). The PLS-DA model was validated by CV-ANOVA, p = 0.0104, F = 4.44.

