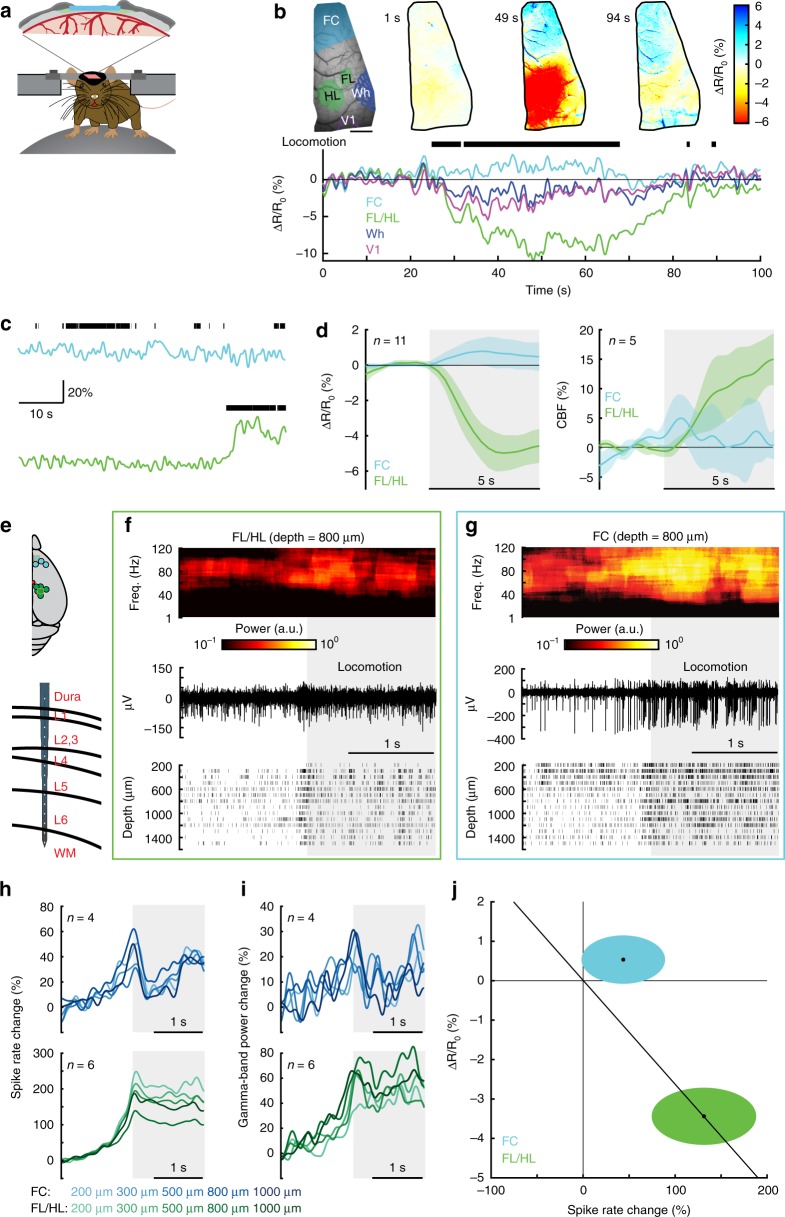
Fig. 1.
Locomotion drives cortical region specific hemodynamic and neural responses. a Experimental setup for IOS imaging. b Example showing CBV change during voluntary locomotion. Top left, an image of thin-skull window and corresponding anatomical reconstruction; scale bar = 1 mm. Top right, reflectance map before (1 s), during (49 s) and after (94 s) a voluntary locomotion event. Bottom, percentage change in reflectance (∆R/R0) during locomotion events for each brain region. Wh, vibrissae cortex; V1, visual cortex. c Example showing locomotion-evoked changes of CBF in FC (top) and FL/HL (bottom) in the same animal. d Population average of locomotion-triggered average of CBV (n = 11 mice, left) and CBF (n = 5 mice, right) responses in both FL/HL (green) and FC (blue). Data are shown as mean ± SD. e Top, all laminar electrophysiology measurement sites in FC (n = 4 mice) and FL/HL (n = 6 mice). The squares indicate the measurement sites showing in (f) and (g). Bottom, layout of the electrodes and measurement depth. f Example trial showing the large increase in gamma-band LFP power (top), raw signal (middle), and spike raster (bottom) during locomotion from a site 800 µm below the pia in FL/HL. Shaded area indicates the time of locomotion. g As in (f) but for FC. h Group average of locomotion-evoked spike rate responses in both FC (top, n = 4 mice) and FL/HL (bottom, n = 6 mice). i As in (h) but for locomotion-evoked gamma-band LFP power responses. j Changes of ∆R/R0, 2–5 s after the onset of locomotion plotted against spike rate change 0–2 s after the onset of locomotion in FL/HL (green ellipse) and FC (blue ellipse). For each ellipse, the radius along the vertical axis is the SD of ∆R/R0 across all 11 mice; the radius along the horizontal axis is the SD of spike rate across all animals (n = 4 for FC and n = 6 for FL/HL). The black dot in the center of each ellipse represents the average value of ∆R/R0 and spike rate response. The diagonal line shows the prediction of linear coupling.

