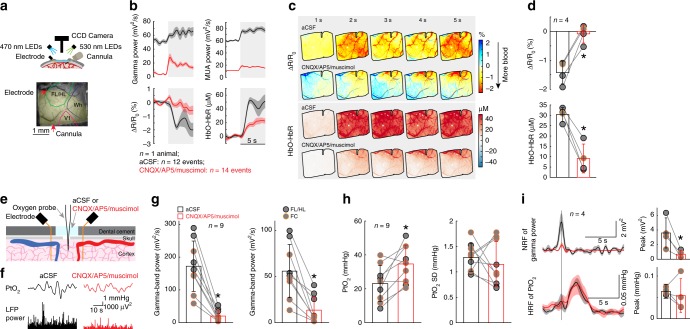
Fig. 3.
Locomotion-evoked cortical oxygenation increases persist when vasodilation is blocked. a Experimental setup for spectroscopy. b Locomotion-evoked gamma-band LFP power (top left), MUA power (top right), ∆R/R0 (bottom left) and HbO-HbR (bottom right) in one representative mouse following aCSF (black, 12 locomotion events) and CNQX/AP5/muscimol (red, 14 locomotion events) infusion. c Locomotion-evoked spatial distribution of ∆R/R0 (top) and HbO-HbR (bottom) for the same mouse shown in (a) and (b) following aCSF and CNQX/AP5/muscimol infusion. d Group average of locomotion-evoked ∆R/R0 (top, * paired t-test, t(3) = 7.4235, p = 0.0051) and HbO-HbR (bottom, * paired t-test, t(3) = 8.0007, p = 0.0041) after aCSF or CNQX/AP5/muscimol infusion in four mice. The orange circle denotes the mouse shown in (b) and (c). e Experimental setup for simultaneous PtO2 and LFP measurements. f Example of resting PtO2 fluctuations (top) and resting gamma-band LFP fluctuations (bottom) in FL/HL in a single mouse. g Comparison of spontaneous LFP activity (left, * Wilcoxon signed-rank test, p = 0.0039) and fluctuations (SD, right, * paired t-test, t(8) = 5.0246, p = 0.0010) before (black) and after (red) application of CNQX/AP5/muscimol in FL/HL (4 mice, black circle) and FC (five mice, orange circle). h As (g) but for spontaneous PtO2 activity (left, * paired t-test, t(8) = 3.2712, p = 0.011) and fluctuations (SD, right, * paired t-test, t(8) = 0.7542, p = 0.4723). i Top left, NRF of gamma-band LFP power (n = 4 mice, 1 in FL/HL and 3 in FC) before and after application of CNQX/AP5/muscimol. Vertical black line indicates the start of a brief impulse of locomotion. Bottom left, as in top left but for HRF of PtO2. Top right, peak amplitude of NRF of gamma-band LFP power before and after application of CNQX/AP5/muscimol (*paired t-test, one sided, t(3) = 3.4299, p = 0.0208). Bottom right, as in top right but for peak amplitude of HRF of PtO2 (paired t-test, t(3) = 0.5861, p = 0.599). Solid lines and shaded area in (b) and (i) denote mean ± SEM, respectively. Data are shown as mean ± SD in all other graphs.

