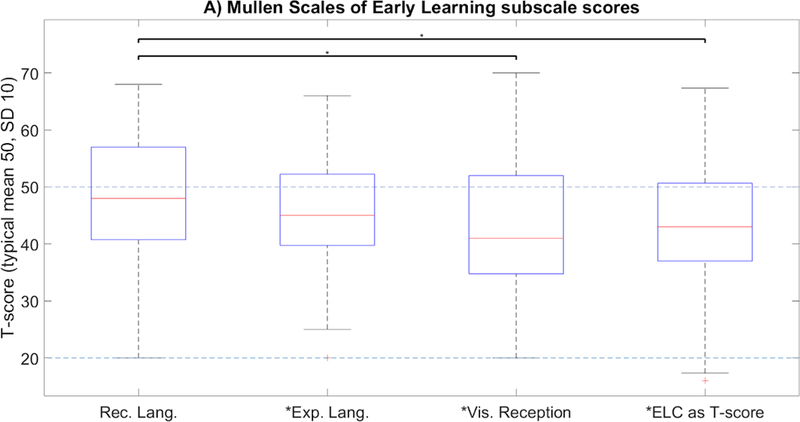
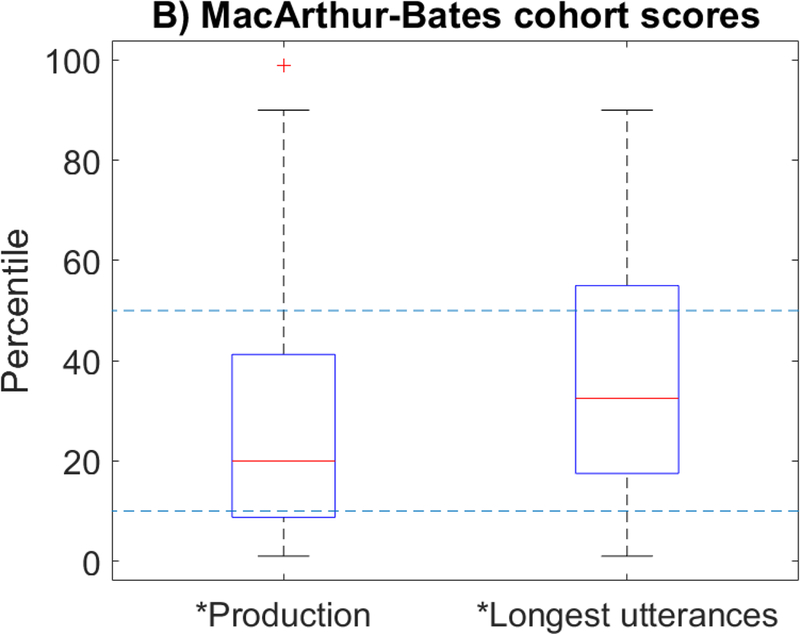
Figure 1: Whole-cohort testing characteristics.


Asterisk on x-axis label indicates significant group difference below testing norms (p<0.05); starred bracket indicates significant discrepancy in performance between domains (p<0.05). T-scores are normed against typical validation groups with mean scores of 50 and a standard deviation of 10.
