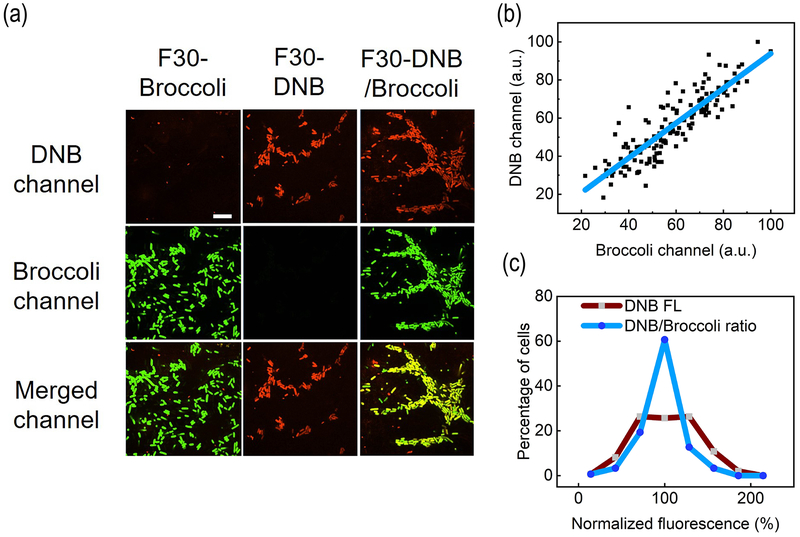
Figure 3.
Orthogonal live-cell imaging of DNB and Broccoli. (a) Fluorescence imaging of BL21 (DE3)* cells expressing F30-Broccoli, F30-DNB, or F30-DNB/Broccoli in the presence of 200 μM DFHBI-1T and 1 μM SR-DN. Scale bar, 10 μm. (b) A linear correlation between DNB and Broccoli fluorescence in 150 cells expressing F30-DNB/Broccoli. Pearson’s r2= 0.8. (c) After analyzing 150 individual F30-DNB/Broccoli expressing cells, distribution of DNB fluorescence levels were compared to that of DNB/Broccoli ratio.

