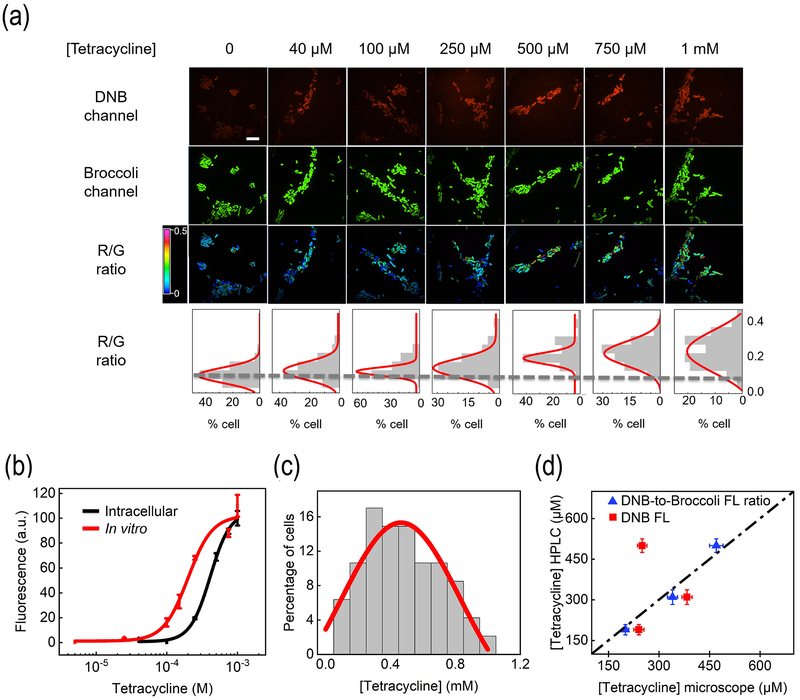
Figure 4.
Intracellular imaging of tetracycline. (a) Fluorescence imaging of BL21 (DE3)* cells expressingjj Tc-D/B after 70 min incubation with 0 – 1,000 μM tetracycline. Scale bar, 10 μm. According to the DNB-to-Broccoli fluorescence (R/G) ratio of 300 individual cells from three experimental replicates, a distribution curve was generated. (b) In vitro and cellular dose-response curves of Tc-D/B based on the mean and SEM DNB-to-Broccoli fluorescence ratio. (c) Cellular distribution of tetracycline after adding 1 mM tetracycline. Individual cells were binned according to tetracycline concentration. The percentage of cells in each bin was plotted. (d) Validation of the determined cellular tetracycline levels with an HPLC assay after adding 250, 500, and 1,000 μM tetracycline. The tetracycline levels were determined based on either DNB fluorescence only (red) or DNB-to-Broccoli fluorescence ratio (blue).

