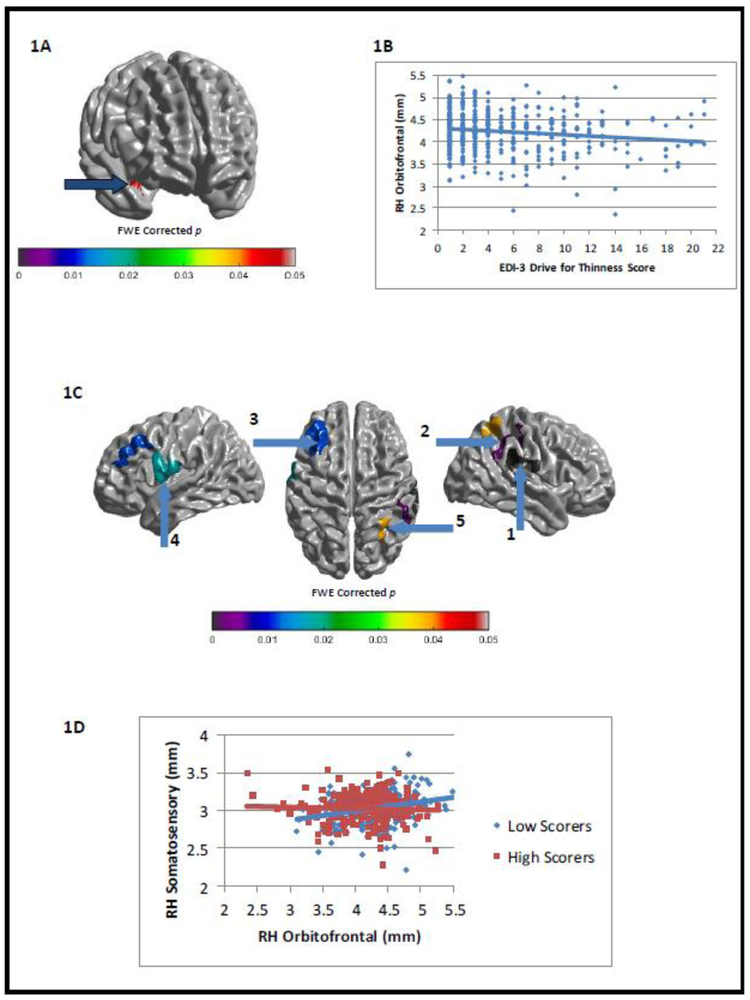
Figure 1.
Family wise error-corrected associations between EDI-3 Drive for Thinness (EDIThn) scores and cortical thickness/intracortical correlations: (A) negative correlation between EDIThn and cortical thickness in right orbitofrontal cortex (x=33, y=10, z=−15) and (B) its associated scatterplot; (C) group differences between low- and high-EDIThn scorers in intracortical correlations between right orbitofrontal cortex (see Figure 1A) and the rest of cortex and (D) a sample scatterplot of the relationship between right orbitofrontal cortex thickness (see Figure 1A) and right somatosensory cortex thickness (Figure 1C, seed 2; x=45, y=−24, z=44) as a function of low- and high-EDIThn scorers.

