Fig. 2.
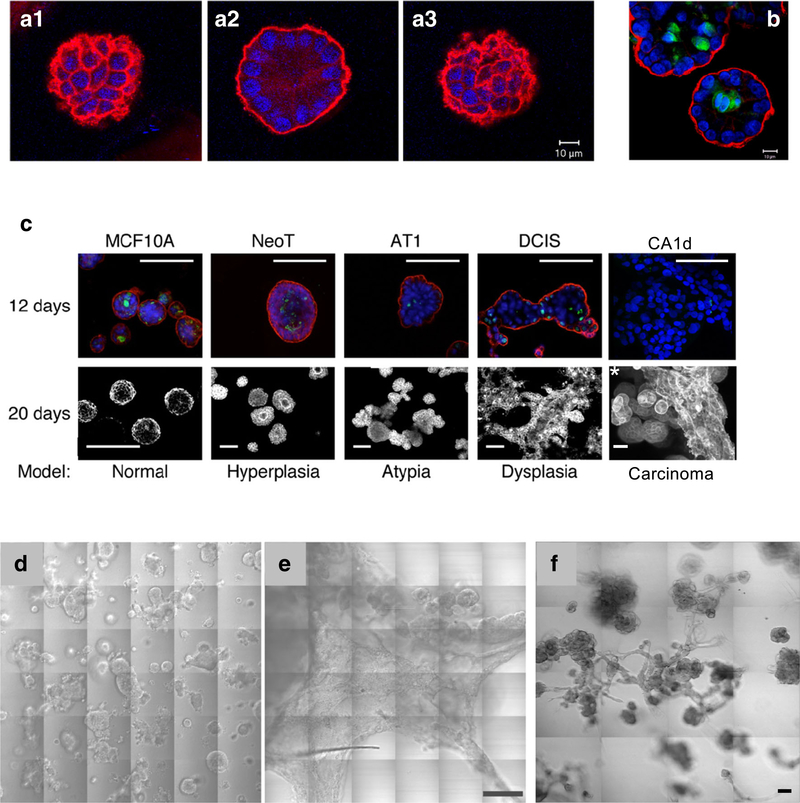
Pathomimetic avatars of MCF10 variants. Individual acini of MCF-10A human breast epithelial cells are polarized when grown for 12 days in 3D rBM overlay mono-cultures. This is indicated by staining for the basal polarity marker, α6 integrin (red), in confocal sections at the top (A1), middle (A2), and bottom (A3) of this acinus. Apoptosis results in lumen formation, as shown in this equatorial plane of an acinus stained for cleaved caspase 3 (B, green). Nuclei are stained with DAPI (blue). Size bars, 10 μm. C 3D rBM overlay cultures of MCF10 variants model hyperplasia, atypical hyperplasia, dysplasia, and carcinoma. Images in upper row represent a single confocal section at the equatorial plane of 12-day cultures that were fixed and stained for the basal polarity marker, α6 integrin (red); the apoptotic marker, cleaved caspase 3 (green); and nuclei with DAPI (blue); size bars, 50 μm. Lower row shows differential interference contrast images of 20-day live cultures with the exception of the *CA1d sample, which was fixed and processed at 8 days; size bars, 50 μm. In 3D rBM overlay cultures, DCIS (D) and CA1d (E) variants of the MCF10 series develop into large preinvasive dysplastic structures and extensive invasive tumoroids, respectively. This is illustrated in 36 contiguous tiled areas representing a 1200 × 1200 μm field; size bar, 200 μm. Regions of tumoroid invasion into the matrix are revealed by change in focus in panel E. F Co-culture of human breast carcinoma-associated fibroblasts (CAFs) with DCIS cells confers an invasive phenotype. In 3D rBM overlay co-cultures of DCIS and CAFs at a ratio of 5:1, extensive multicellular invasive outgrowths are present (compare with DCIS cells in 3D mono-cultures in panel D). Differential interference contrast images of live cultures were obtained at 8 days of culture and presented here as 16 contiguous tiled fields. Scale bar, 90 μm. Imaging was conducted on a Zeiss LSM-510 META confocal microscope

