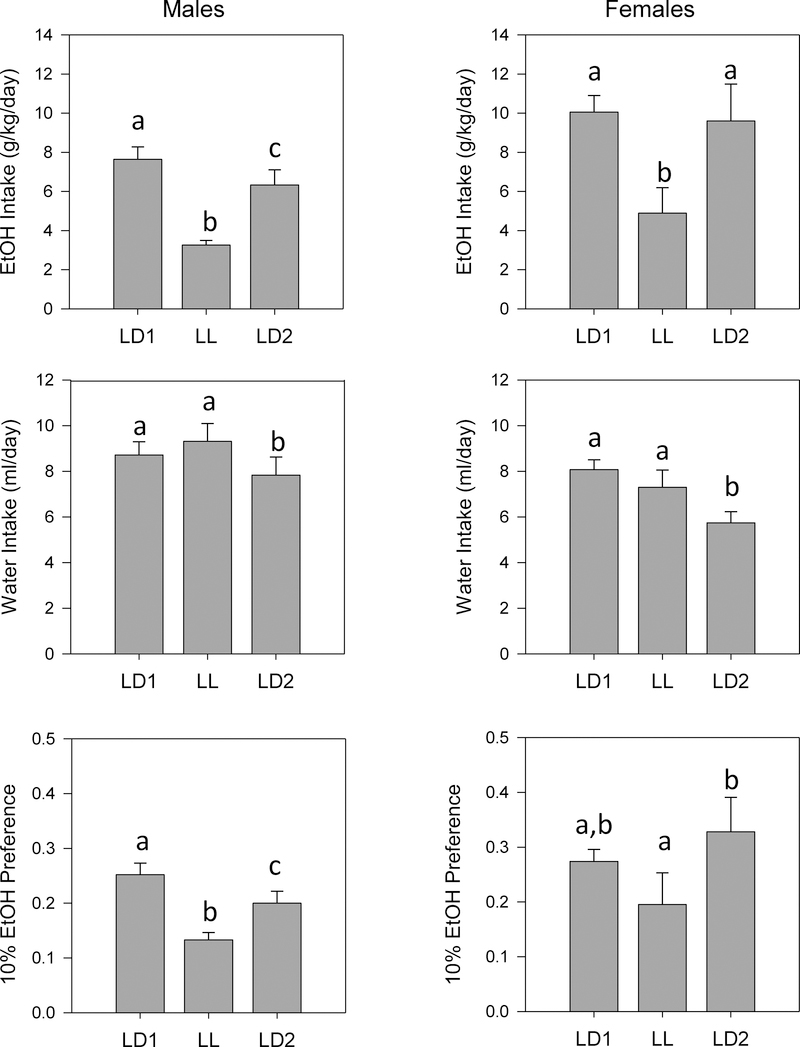
Figure 9.
Means +/− standard errors for fluid intake parameters in male and female WSC mice (n=15 per sex) tested in Sequence 2 (LD1, LL, LD2). Ethanol Intake: top panels; water intake: middle panels; 10% Ethanol Preference ratio: bottom panels. Males are on the left and females on the right. Other conventions as in Fig. 2.

