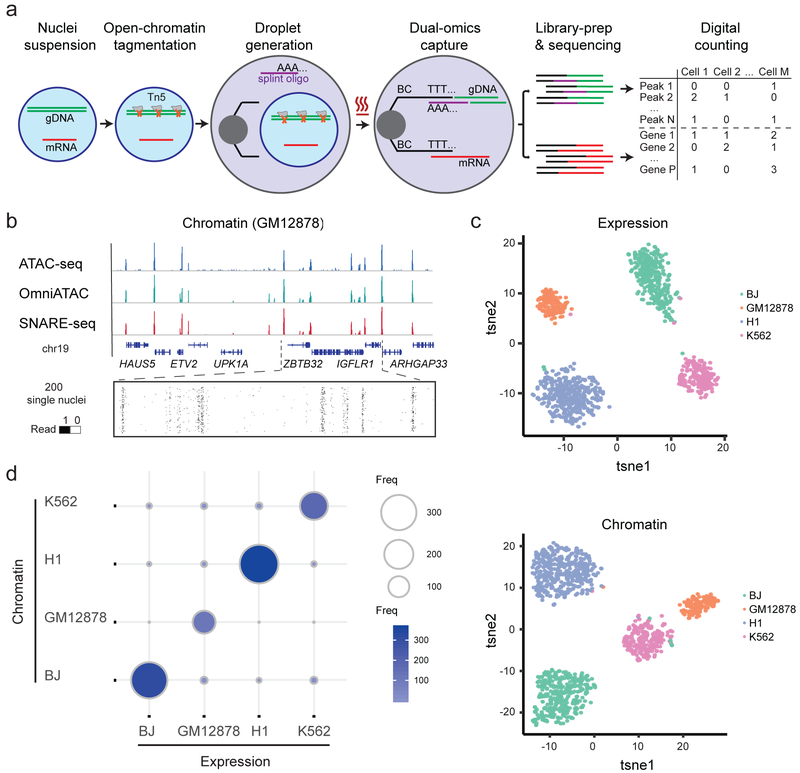
Figure 1.
Linked single-nucleus transcriptome and chromatin accessibility sequencing of human cell mixtures. a, Workflow of SNARE-seq. Key steps are outlined in the main text. b, Aggregate single-nucleus chromatin accessibility profiles recaptured published profiles of ATAC-seq and Omni-ATAC in GM12878 cells. c, t-SNE visualization of SNARE-seq paired gene expression (upper panel) and chromatin accessibility (lower panel, n=1,047) data from BJ, GM12878, H1 and K562 cell mixture. Cellular identities are colored based on independent clustering results with either expression or chromatin data. d, Inter-assay identity agreement reveals consistent linked transcriptome and chromatin accessibility profiles of SNARE-seq data. The size and color depth of each circle represents the number of cellular barcodes that were identified by the different assays.

