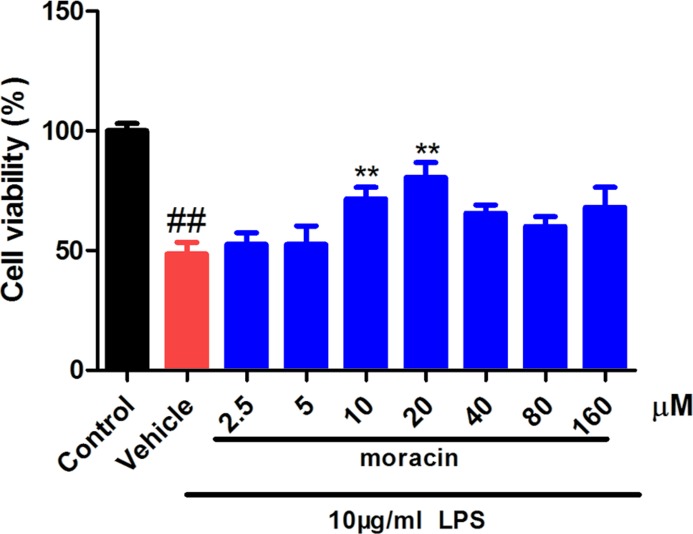
Figure 1. Effects of moracin on cell viability.
The moracin cell viability was measured by CCK8.The concentration of LPS with 10 μg/ml was used to induce the inflammation. The values are presented as the mean ± standard deviation. *P < 0.05 compared with the LPS group; **P < 0.01 compared with the LPS group; ##P < 0.01 compared with the control group.

