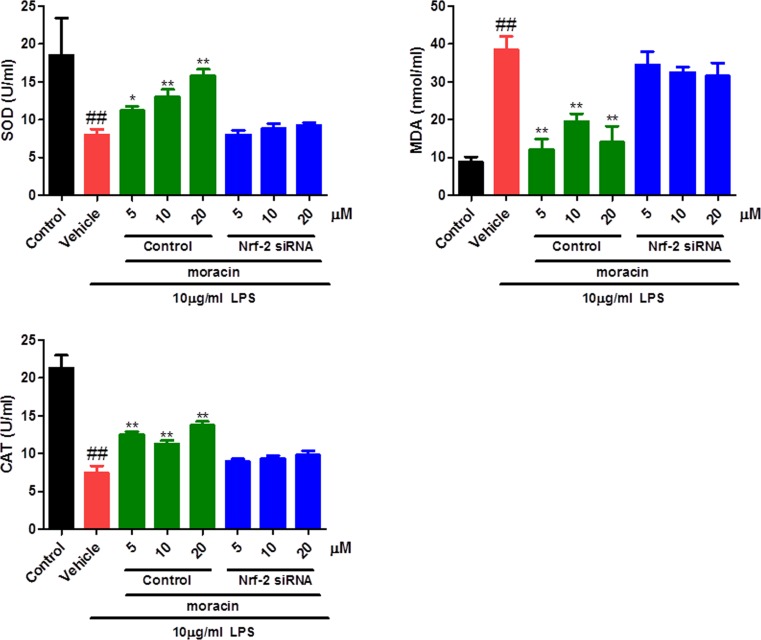
Figure 3. Effects of moracin on SOD, MDA and CAT in LPS-induced primary nucleus pulposus cells.
The levels of SOD, MDA and CAT in cell supernatant were recorded using the commercial kits on the basis of the manufacturer’s instruction. The concentration of LPS with 10 μg/ml was used to induce the inflammation. The values are presented as the mean ± standard deviation. *P < 0.05 compared with the LPS group; **P < 0.01 compared with the LPS group; ##P < 0.01 compared with the control group.

