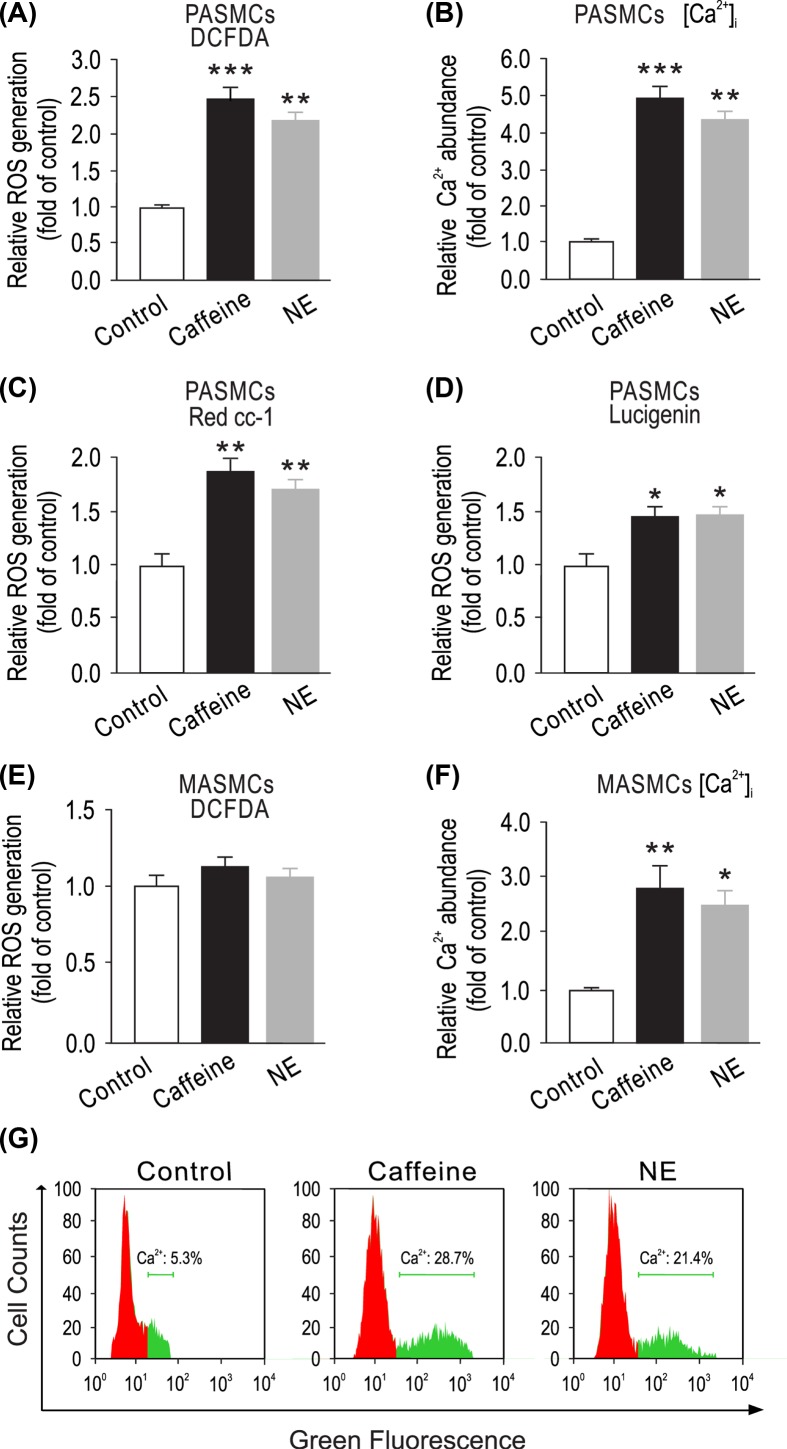
Figure 1. Elevation of [Ca2+]i by caffeine or norepinephrine increases ROS production in cytosol of PASMCs, but not MASMCs.
(A) PASMCs were treated with caffeine (200 μM) or norepinephrine (20 μM) for 5 min. Intracellular ROS generation was measured using DCFDA assay. (B) PASMCs were exposed to caffeine (200 μM) or norepinephrine (20 μM) for 5 min, and Ca2+ levels were then detected using a Ca2+ quantification kit. (C) Red CC-1 and lucigenin (D) assay was used to determine ROS generation in PASMCs. (E) MASMCs were treated with caffeine (200 μM) or norepinephrine (20 μM) for 5 min. Intracellular ROS generation was measured using DCFDA assay. (F) MASMCs were exposed to caffeine (200 μM) or norepinephrine (20 μM) for 5 min, and Ca2+ levels were then detected using a Ca2+ quantification kit. Data represent mean ± SEM; n = 6, *P < 0.05; **P < 0.01; ***P < 0.001, compared with control by two-tails Student’s t test. (G) Fluo3-AM staining of cytosolic Ca2+ ions in PASMCs. PASMCs were treated with caffeine (200 μM) or norepinephrine (20 μM) for 5 min, then stained with 0.5 μ M Fluo-3-AM in HBSS buffer.

