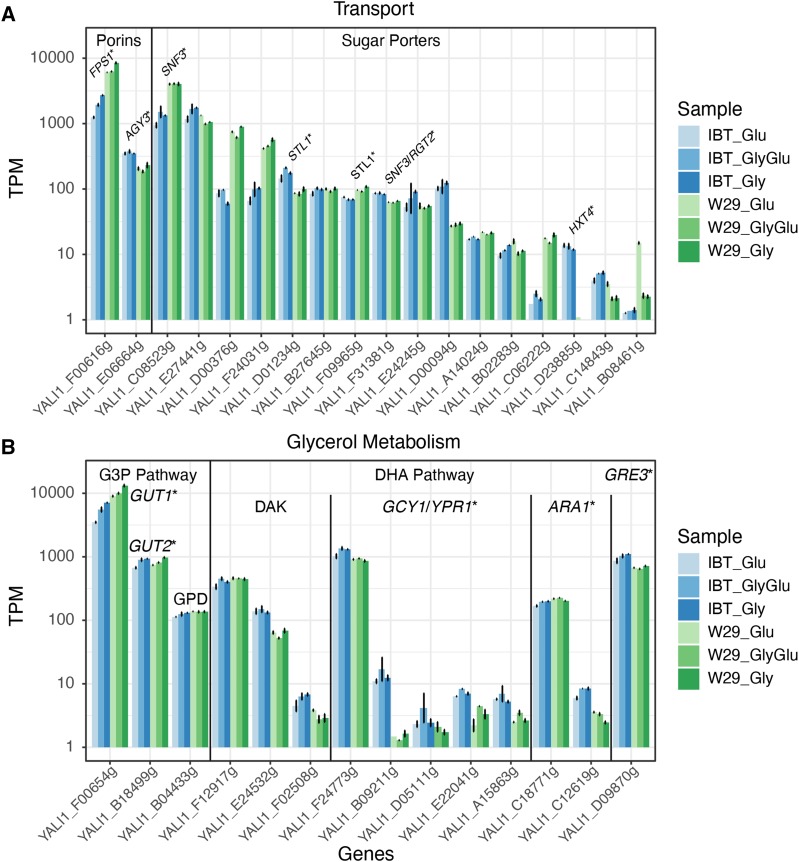
Figure 3.
Results of the targeted transcriptome analysis. Expression levels are shown in log transcripts per million (logTPM) and names of S. cerevisiae orthologs are provided. (A) Expression of genes related to glycerol and sugar transport (see Table S1 for gene information). (B) Expression levels of genes related to glycerol metabolism (see Table S2 for gene information).

