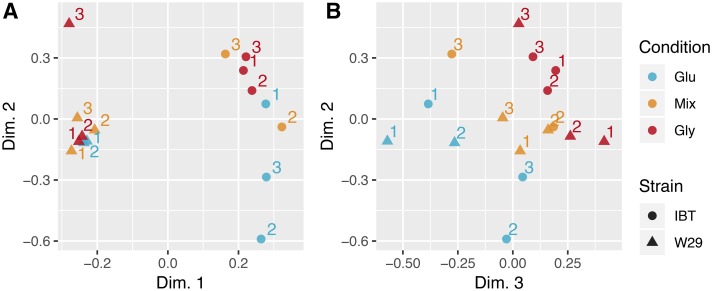
Figure 5.
Singular Value Decomposition (SVD) plots showing separation by strains in dimension 1 vs. dimension 2 (A), and separation by growth condition in dimension 3 vs. dimension 2 (B). Numbers indicate the replicate within the strain and condition group. Dimensions 1-3 accounted for 47%, 14% and 10% of the total variance, respectively, in the RNA-Seq data set.

