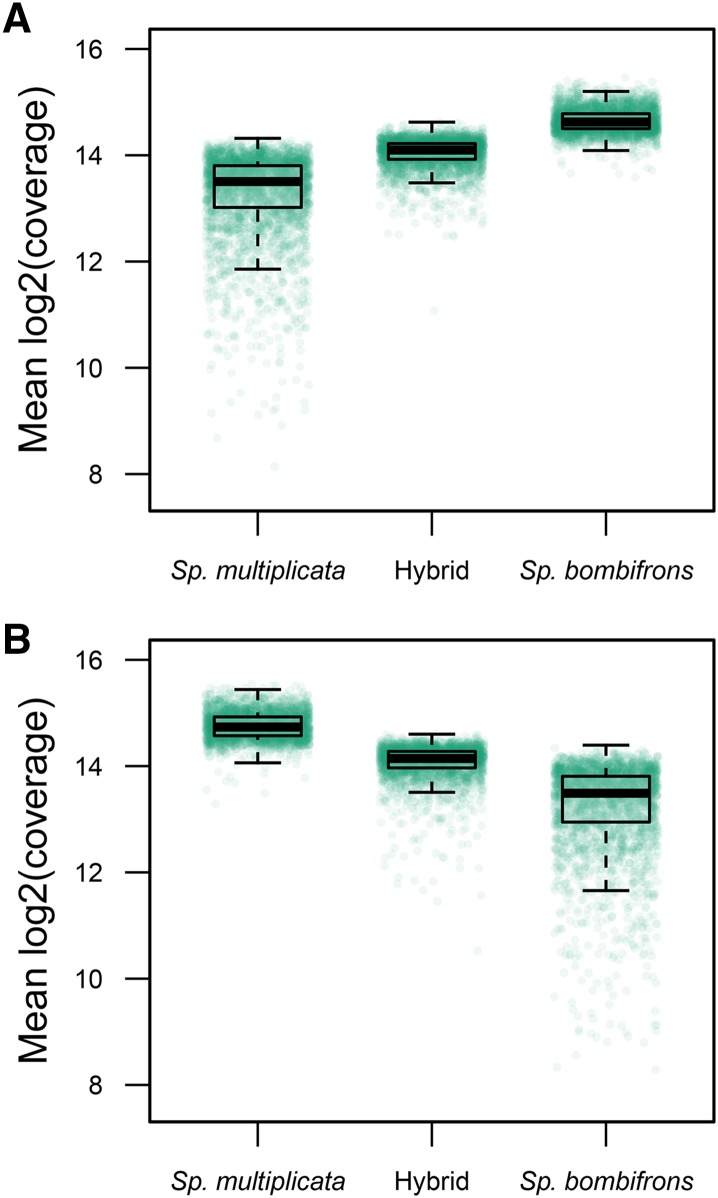
Figure 5.
Gene expression analysis in Spea hybrids. Genes exhibiting differential expression between Sp. bombifrons and Sp. multiplicata are shown in these pure species and their hybrids. Genes expressed at a higher level in Sp. bombifrons (n = 3,123) are shown in A, while genes expressed at a higher level in Sp. multiplicata (n = 2,742) are shown in B. Each point represents the average expression level of a single gene across all samples in a given class.

