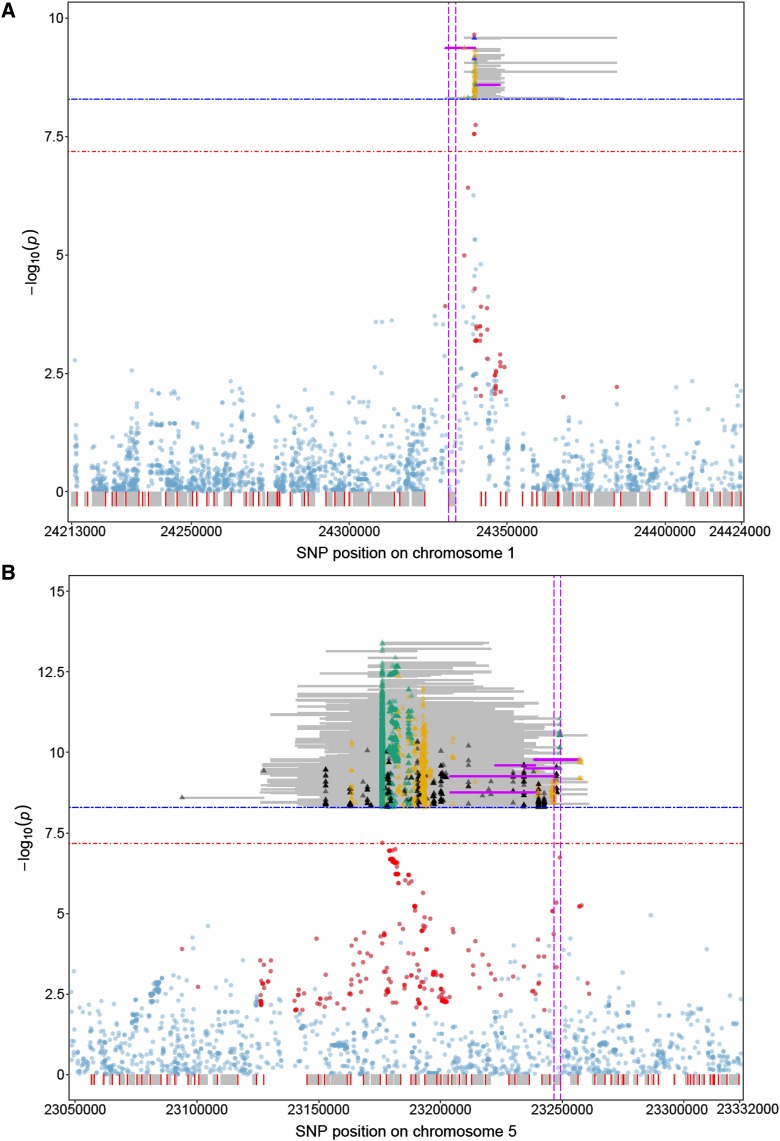
Figure 3.
Details of significant associations for the trait flowering time revealed by SNP-based and functional haplotype-based GWAS in two chromosome regions. Panels (A) and (B) refer to the analysis of data set FT10 for regions I and V, respectively. SNP positions on the different chromosomes are shown on the x axis relative to the corresponding -log10(P) values on the y axis. The depicted regions reflect the chromosome segments for which overlapping functional haplotypes had been obtained, but only those functional haplotypes are shown which passed the stringent adjusted significance threshold of -log10(P) = 8.29 as gray or pink lines. Pink lines highlight representative significant functional haplotypes. The positions of the first and third SNP of a particular haplotype on the chromosome mark the beginning and end of the line, respectively. A colored triangle indicates the SNP of a haplotype for which the lowest P value was observed by SNP-based GWAS. P values ranging from 1 × 10⁻⁴ to 1 × 10⁻², 1 × 10⁻⁶ to 1 × 10⁻⁴, 1 × 10⁻⁸ to 1 × 10⁻⁶ are represented as black, orange and green triangles, respectively. Blue triangles represent P values smaller than 1 × 10⁻⁸. The translucent pale blue and red dots correspond to the P values of SNPs obtained in single SNP-based GWAS, red dots represent those SNPs that were part of significant functional haplotypes. Below the x axis the coding regions of genes in the region are shown as gray boxes, 5′-regions are indicated as red lines. Two vertical pink dashed lines are used to mark the position of the coding region of the candidate gene. The red and blue horizontal stippled lines correspond to the significance thresholds for single SNP-based and FH GWAS, respectively.

