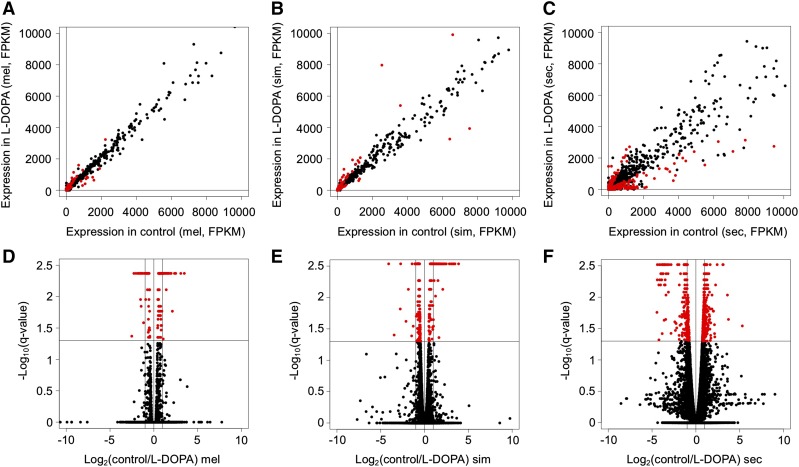
Figure 3.
Genome-wide gene expression responses to L-DOPA. A-C) Scatterplots are shown for the comparison between flies fed control food (X-axis) and those fed food containing 10µg/ml L-DOPA (y-axis) with gene expression represented as F ragments P er K ilobase of sequence per M illion reads (FPKM) where each point is one gene with A) D. melanogaster, B) D. simulans and C) D. sechellia. D-F) Volcano plots are shown for the same comparison (control vs. 10µg/ml L-DOPA) for each species D) D. melanogaster, E) D. simulans and F) D. sechellia where expression response represented as Log(control FPKM/L-DOPA FPKM) on the x-axis and the significance of a statistical test for that gene represented as -Log10(q-value) where q is the false discovery rate corrected p-value on the y-axis.

