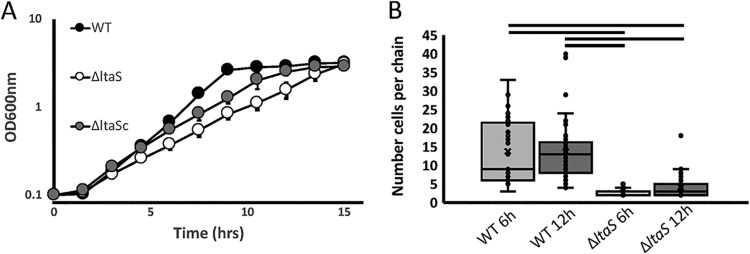
FIG 3.
ltaS deletion affects growth and chain length. (A) Growth curve of S. gordonii strains (WT, ΔltaS, and ΔltaSc) as determined by optical density (λ = 600 nm). Data represent means of results from three independent biological replicates (± standard deviations [SD]). (B) Number of cells per chain of S. gordonii in samples from WT and ΔltaS strains collected after 6 and 12 h of growth visualized by light microscopy. Each data point represents one chain. Bars on top of the graph show statistical significance (P < 0.05) as determined by analysis of variance (ANOVA).

