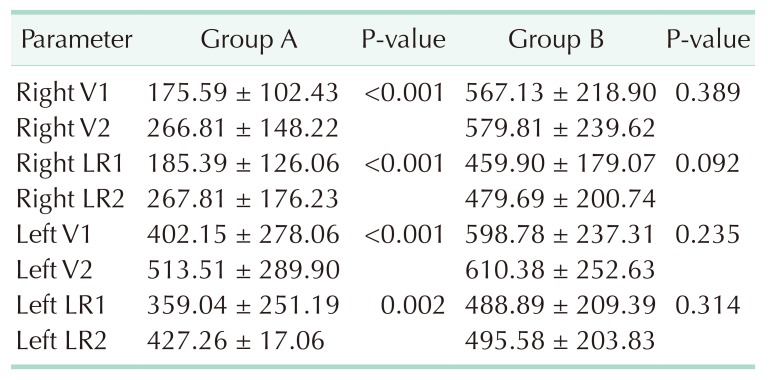
Table 3. Comparison of intraoperative neuromonitoring values.
Values are presented as mean ± standard deviation.
Group A, control group; group B, sugammadex group; Right V1, first signal obtained from right vagus nerve (>100 µV) (as the initial signal obtained before starting thyroid gland dissection); Right V2, VN stimulation after right lobectomy; Right LR1, RLN stimulation prior to right lobectomy; Right LR2, RLN stimulation after right lobectomy, Left V1, VN stimulation prior to left lobectomy; Left V2, last signal left vagus nerve (as the last signal obtained after completing the thyroid gland resection); Left LR1, RLN stimulation prior to left lobectomy; Left LR2, RLN stimulation after left lobectomy.

