Figure 4.
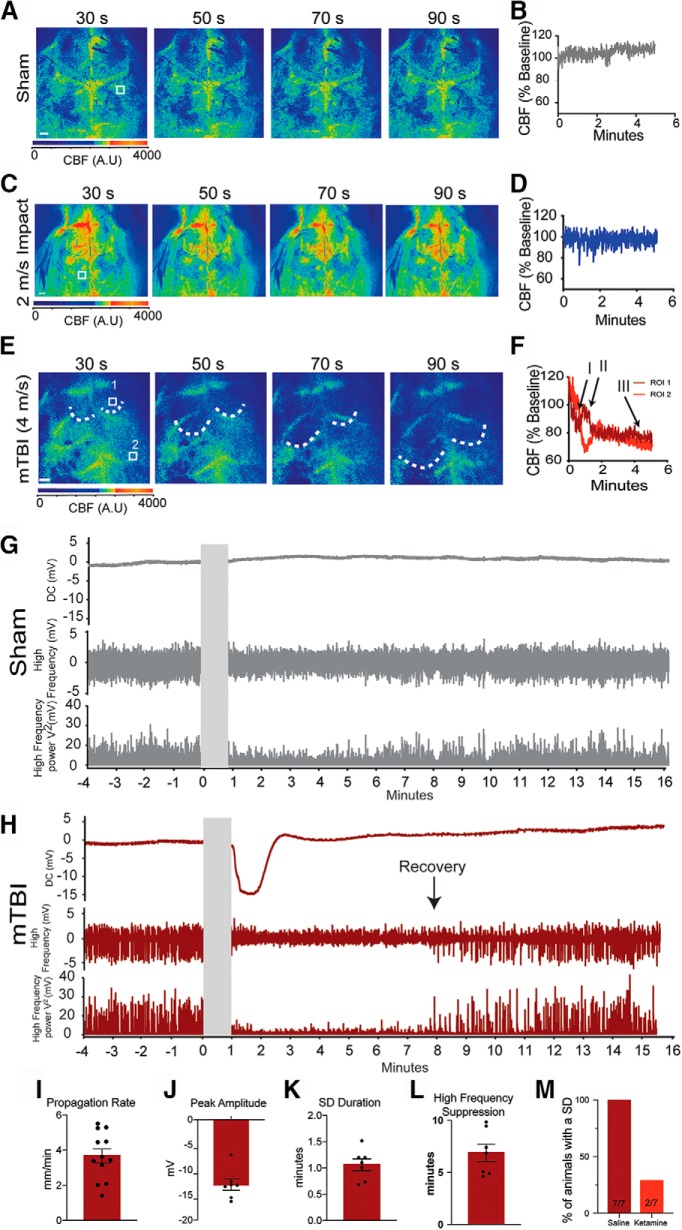
Impacts associated with mTBI-like behavior produce SD. LSCI was used to assess CBF before and immediately after treatment. Representative LSCI images from a sham (A), 2 m/s (C), and mTBI (4 m/s; E) animals are shown. Warmer colors indicate more blood flow and the white boxes indicate the ROIs used to create the time plots. Scale bars = 500 μm (in the LSCI images). Dotted lines indicate the leading edge of the propagation wave. Graphical representations of the CBF from the indicated ROIs are shown for sham (B), 2 m/s (D), and mTBI (F) animals. The two ROIs from the mTBI animals indicate the propagation of the hemodynamic response. Representative electrophysiological recordings of the extracellular field potential, high-frequency activity, and the total power (V2) of the high frequency from a sham (G) and mTBI animal (H). Cumulative data of the propagation rate (I), the SD extracellular field potential DC shift peak amplitude (J) and duration (K), and the duration of high-frequency suppression (L). Ketamine (120 mg/kg) was given systemically 30-min before impact and the presence of an SD was assessed using LSCI (M).

