Figure 2.
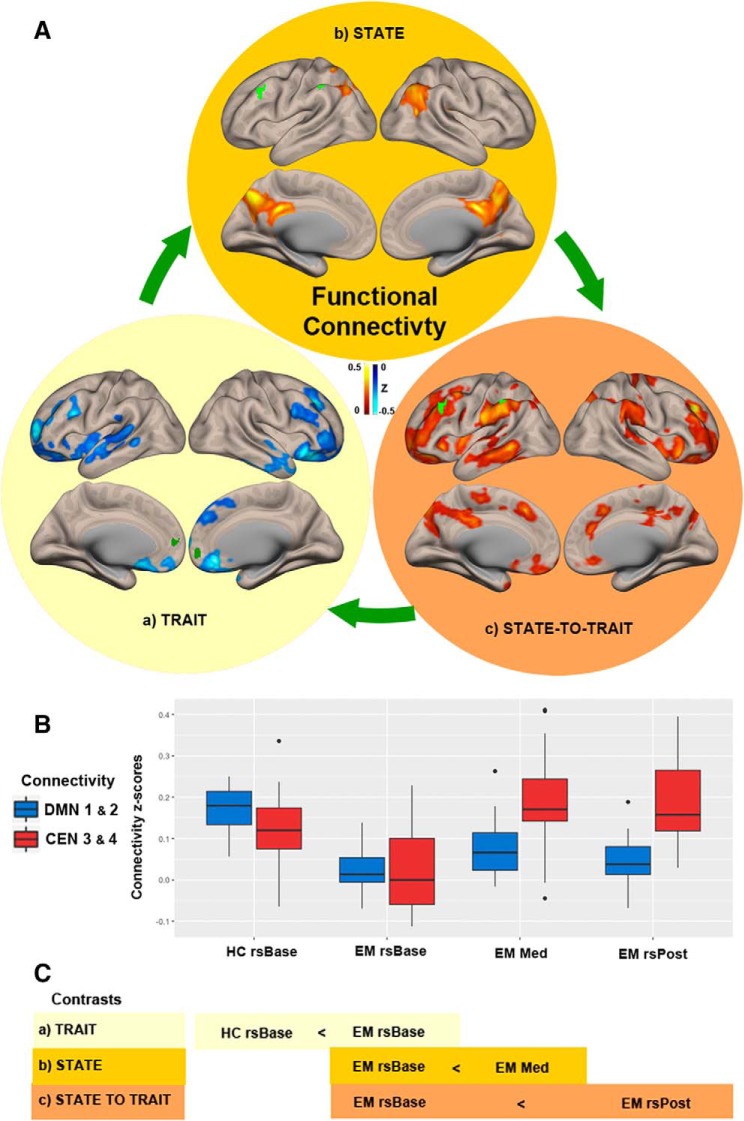
State-to-trait meditation functional connectivity (FC) changes. Aa, Brain regions showing trait FC changes between experienced meditators (EM) and healthy controls (HCs) at baseline (HC rsBase < EM rsBase). Ab, Brain regions that show significant FC changes during the meditation state in meditators (EM rsBase < EM Med). Ac, Brain regions that show significant FC changes during the transition from state-to-trait meditation in meditators (EM rsBase < EM rsPost). Dark green (DMN ROIs 1 and 2) and light green (CEN ROIs 3 and 4) clusters show in each case the seeds used to determine the shown contrast (Fig. 1Aa). B, Boxplot showing mean FC z-scores in blue (DMNs 1 and 2) and red (CENs 3 and 4) during baseline (rsBase), meditation (Med), and post-meditation (rsPost) for HCs and EMs. C, Schematic representation of state-to-trait contrasts. All stats shown are nonparametric (1000 permutations) with height threshold p < 0.05 and cluster-size FDR-corrected p < 0.05. Black dots represent subjects that lie beyond the whiskers.

