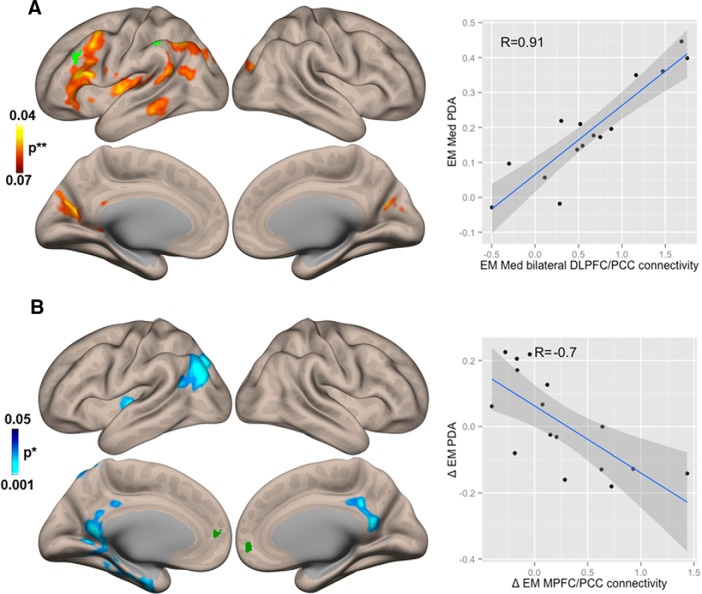
Figure 3.
Correlations between Positive Diametric Activity (PDA) and Functional Connectivity (FC). A, Brain regions that show significant correlation between PDA and FC during the meditation state in experienced meditators (EM) (EM Med). B, Brain regions that show significant correlation between the change in PDA and change in FC during the transition from state-to-trait meditation (ΔEM = rsBase - rsPost). Dark green clusters at the Default Mode Network (DMN ROIs 1 and 2 from Fig. 1Aa) and bright green clusters at the Central Executive Network (CEN ROIs 3 and 4 from Fig. 1Aa) show in each case the seeds used to determine the estimated contrast. *nonparametric (1000 permutations) with height threshold p < 0.05 and cluster-size FDR-corrected p < 0.05; **parametric stats with height threshold p < 0.05 and cluster-size FDR-corrected p < 0.05.

