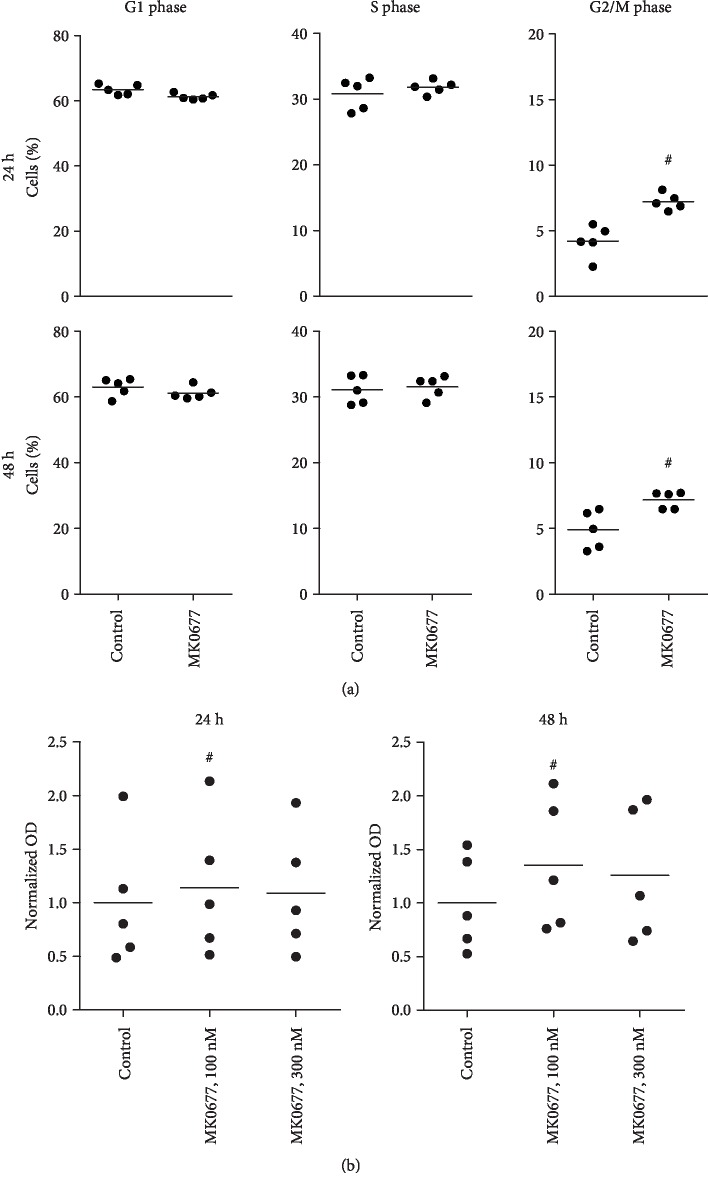
Figure 5.
Effects of MK0677 on cell cycle and viability in WPMY-1 cells. (a) Effects of MK0677 (100 nM, 24-48 h) on cell cycle phases, assessed by flow cytometry analyses. Shown are representative experiments (left panels), and single values from each of five independent experiments, with mean for each gene as bar (#p < 0.05 vs. control after Wilcoxon Rank Sum test). In figures for representative experiments, the G1 phase is represented by the first red peak, the G2/M phase by the second red peak, and the S phase by the hatched areas. (b) Effects of MK0677 on viability, assessed by CCK-8 assays (single values from each of five independent experiments, with mean for each gene as bar) (p < 0.04 vs. control after Friedman two-way ANOVA by ranks).

