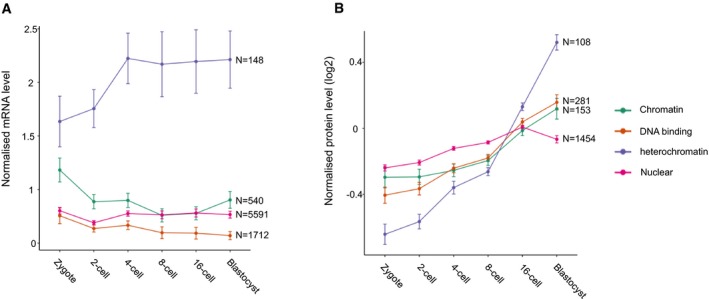
Figure 3. mRNA and protein levels of the selected heterochromatin and control datasets during mouse preimplantation embryonic development.

- Mean ± SEM mRNA levels normalised to the sum of expression across detected genes during preimplantation development (data from Deng et al). The analysis was carried out for the 148 genes coding for the heterochromatin proteins as well as all the genes with “chromatin” (540), “DNA binding” (1,712) or “nuclear” (5,591) in their GO terms.
- Mean ± SEM protein levels during preimplantation development by mass spectrometry, normalised to average expression of all detected proteins (data from Gao et al). The analysis was carried out for the 108 detected heterochromatin proteins as well as all the proteins with “chromatin” (153), “DNA binding” (281) or “nuclear” (1,454) in the GO terms of their corresponding genes.
