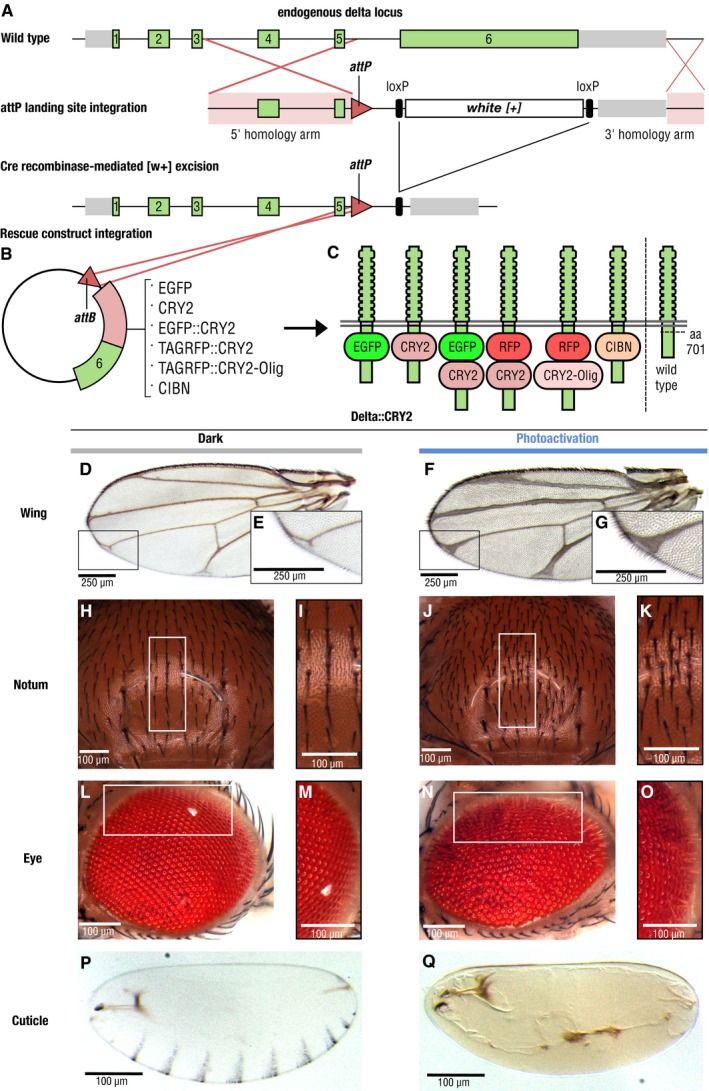
A–CSchematic illustrating the strategy used to generate a functional optogenetic‐tagged allele of the Notch ligand Delta. (A) Gene structure of the Delta locus, green and grey bars represent exons and 5′/3′ UTRs, respectively. Exons 1–6 are shown in green, 5′ and 3′ in grey, homology arms are highlighted in pink, and recombination sites are indicated by red lines. Homologous recombination was used to replace a large portion of the Delta locus between the intron preceding exon 6 to a region downstream of the transcriptional stop site, through knock‐in of an attP landing site and a loxP‐flanked mini‐white cassette. attP knock‐in founder lines were identified as red‐eyed transformants. Cre recombinase was subsequently used to remove the mini‐white cassette, resulting in white‐eyed flies. Delta‐attP white‐eyed founder lines were then transformed with attB rescue construct vectors carrying an attB recombinase binding site upstream of the genomic Delta sequence (B), along with incorporated sequences coding for a variety of tags inserted into an 11 amino acid polyalanine sequence in the intracellular domain of Delta (amino acid 701). (C) Position of the different tags with respect to the Delta protein sequence and its orientation in the plasma membrane.
D–QFlies homozygous for Delta::CRY2 are viable and fertile, and exhibit light‐gated control of Notch signalling during development. Homozygous Delta::CRY2 flies raised in the dark exhibit only a mild Delta phenotype in the terminal tips of the wing (D, E—magnified view). Otherwise, these flies exhibit normal patterning and morphology in tissues including the notum (H, I—magnified view), the eye (L, M—magnified view) and the embryo (P). In contrast, Delta::CRY2 flies reared in the light exhibit Delta loss‐of‐function phenotypes, which include thickening of the wing veins (F, G—magnified view), an increase in microchaeta in the notum (J, K—magnified view), disorganization of the ommatidia (N, O—magnified view) and loss of denticle belt patterning in the embryo (Q). Scale bars, 250 μm in (D–G) and 100 μm in (H–Q).

