-
A–C
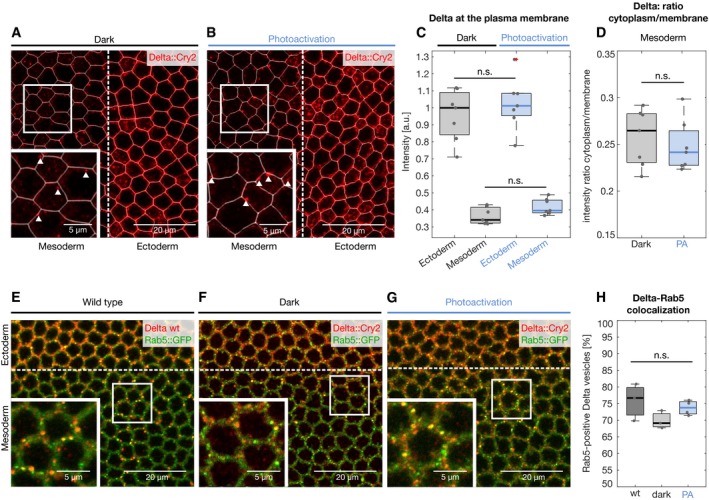
Plasma membrane segmentation of Delta::CRY2 embryos immunostained with anti‐Delta (red) and anti‐Cadherin (used for plasma membrane segmentation, white) antibodies at the end of cellularization, in embryos fixed in the dark (A) or after batch photo‐activation (B). Panels display single confocal z‐slices. Magnified insets in (A, B) show Delta cytoplasmic vesicles (indicated with white triangles) in the mesoderm that are excluded from the plasma membrane segmentation. Plot (C) shows the quantification of Delta plasma membrane levels in the ectoderm and mesoderm in both dark and photo‐activated conditions. In both cases, Delta plasma membrane levels were depleted by ˜70% in the mesoderm compared to the ectoderm. No significant difference was observed when comparing ectodermal or mesodermal Delta plasma membrane levels with or without photo‐activation, indicating that Delta was normally depleted in both conditions. N = 7 embryos for both dark and photo‐activation, n.s. represents no statistically significant difference in a 2‐sample t‐test. In the box plots, the solid horizontal line, bottom and the top edge of each box indicate the median, the 25th percentile and 75th percentile, respectively. Whiskers extend to the most extreme data point. “+” symbols indicate outliers. Scale bars 20 μm and in insets 5 μm (A, B).
-
D
Plot depicting the cytoplasm to membrane ratio of Delta in the mesoderm, both in the dark and upon photo‐activation. No significant difference was observed between both conditions. N = 7 embryos for both dark and photo‐activation, n = ˜40 cells/embryo. n.s. represents no statistically significant difference in a 2‐sample t‐test. In the box plots, the solid horizontal line, bottom and the top edge of each box indicate the median, the 25th percentile and 75th percentile, respectively. Whiskers extend to the most extreme data point.
-
E–H
The extent of colocalization of Delta‐positive vesicles with the early endosomal marker Rab5 did not change upon light‐induced Delta clustering. Single confocal z‐slices of Rab5::GFP (E), Rab5::GFP in a Delta::CRY2 homozygous background embryos either fixed in the dark (F) or after batch photo‐activation (G). In all panels, Delta was visualized by immunostaining using an anti‐Delta antibody (red). The endogenous GFP signal was used to visualize Rab5 (green). Magnified insets in all three panels show colocalization between Delta‐positive vesicles and Rab5 (E–G). Plot (H) shows the extent of colocalization of Delta‐ and Rab5‐positive vesicles. ˜75% of Delta‐positive vesicles colocalized with Rab5, and this value did not significantly differ from wild‐type, Delta::CRY2 (photo‐activated) or Delta::CRY2 (dark) conditions. N = 4 embryos for photo‐activation and N = 3 embryos for wild‐type and dark conditions. n.s. represents no statistically significant difference in a 2‐sample t‐test. In the box plots, the solid horizontal line, bottom and the top edge of each box indicate the median, the 25th percentile and 75th percentile, respectively. Whiskers extend to the most extreme data point. Scale bars, 20 μm and in insets 5 μm (E–G).

