
Figure EV1. TGF‐β activated SMAD2 phosphorylation and ID1 expression in GSCs.
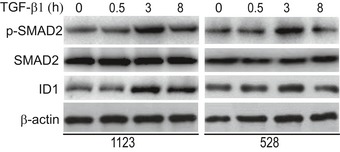
Western blotting of TGF‐β‐activated SMAD2 phosphorylation and ID1 expression in GSCs. 1123 and 528 GSCs were pre‐cultured for 16 h in DMEM/F12 medium with EGF (2 ng/ml) and bFGF (2 ng/ml) and then followed by co‐culturing with or without 20‐μg/ml TGF‐β1 for the indicated times. Data are representative of three independent experiments.