-
A
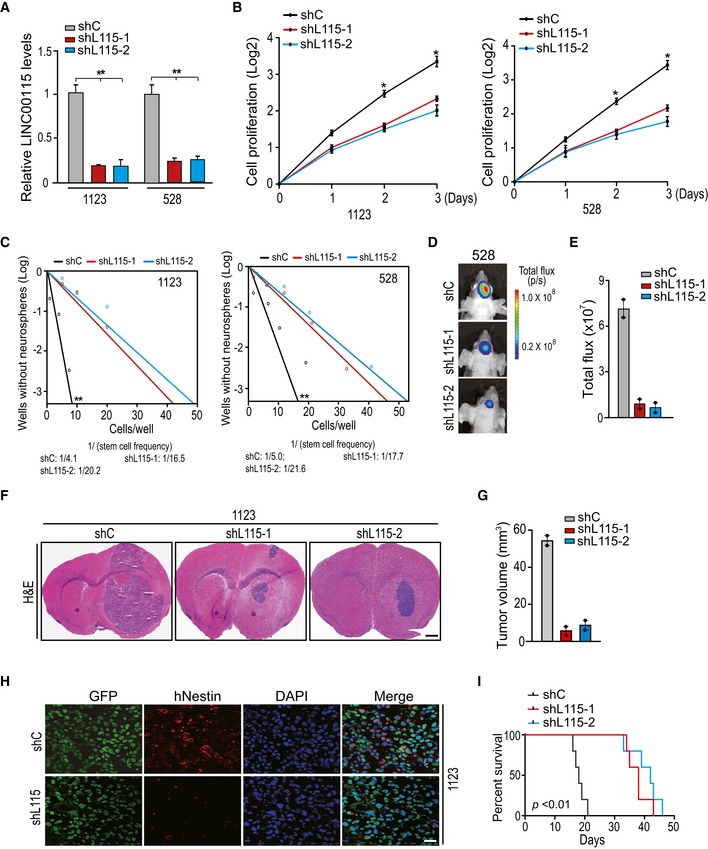
qRT–PCR analysis of LINC00115 knockdown using two different shRNAs, shL115‐1 and shL115‐2 in 1123 and 528 GSCs.
-
B, C
Effects of LINC00115 knockdown on GSC proliferation (B) and neuro‐like sphere formation (C).
-
D
Representative bioluminescence images of brains with indicated 528 GSC tumor xenografts expressing shC, shL115‐1, or shL115‐2 at 45 days after implantation. Images represent the results of five mice per group of two independent experiments.
-
E
Quantification of the bioluminescence activity in (D).
-
F
Representative hematoxylin and eosin (H&E)‐stained images of mouse brain sections with GSC1123 xenografts expressing shC, shL115‐1, or shL115‐2. Images represent the results of five mice per group of two independent experiments. Scale bars: 1 mm.
-
G
Quantification of tumor volume in (F).
-
H
Immunofluorescence (IF) analysis of Nestin expression in 1123 GSC control and LINC00115 knockdown xenograft tumors from (F). Images are representative of two independent experiments. Scale bars: 50 μm.
-
I
Kaplan–Meier analysis of animal implantation with 1123/shC, 1123/shL115‐1, or 1123/shL115‐2 GSCs. n = 10.
Data information: In (A–C), data are representative of three independent experiments. Error bars, ± SD. *
P < 0.05, **
P < 0.01, by one‐way ANOVA in (A and C), by two‐tailed
t‐test in (B). In (I), statistical analysis was performed by log‐rank test.

