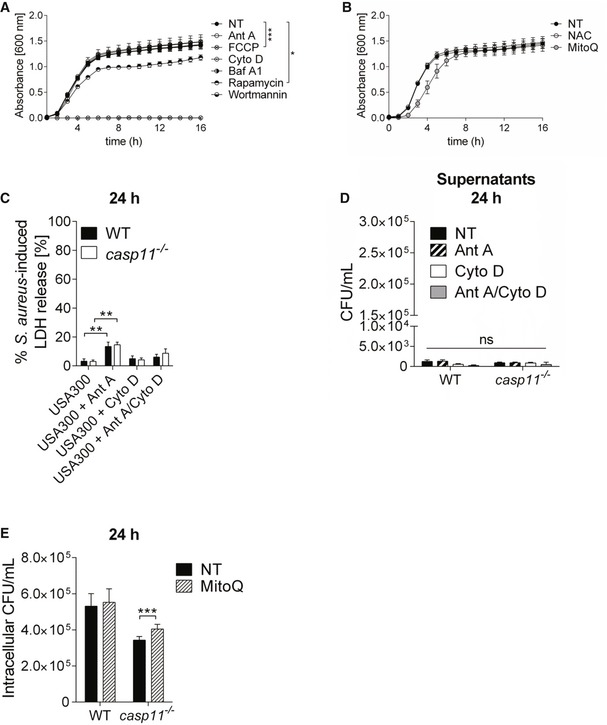
Figure EV2. Role of inhibitors affecting mtROS production, autophagy, and F‐actin polymerization on MRSA growth and macrophage viability.

- MRSA growth in TSB in the presence of Ant A, FCCP, Cyto D, BafA1, rapamycin, and wortmannin (n = 3 biological replicates). Statistical analysis was performed using two‐way ANOVA. *P ≤ 0.05, ***P ≤ 0.001, NT = no treatment.
- MRSA growth in TSB in the presence of NAC and MitoQ (n = 9 biological replicates). Statistical analysis was performed using two‐way ANOVA. NT = no treatment.
- MRSA‐induced LDH release in supernatants from WT and casp11 −/− BMDMs (MOI 5:1) treated with Ant A or Cyto D at 24 h post‐infection (n = 8 biological replicates). Statistical analysis was performed using two‐way ANOVA. **P ≤ 0.01.
- Extracellular growth of MRSA in cell culture supernatants from WT and casp11 −/− BMDMs (MOI 5:1) treated with Ant A or Cyto D at 24 h post‐infection (n = 8 biological replicates). Statistical analysis was performed using two‐way ANOVA. NT = no treatment.
- Intracellular CFU of MRSA in WT and casp11 −/− macrophages treated with MitoQ at 24 h post‐infection (MOI 5:1). Data represent mean ± SEM (n = 8 biological replicates). Statistical analysis was performed using two‐way ANOVA. ***P ≤ 0.001, NT = no treatment.
