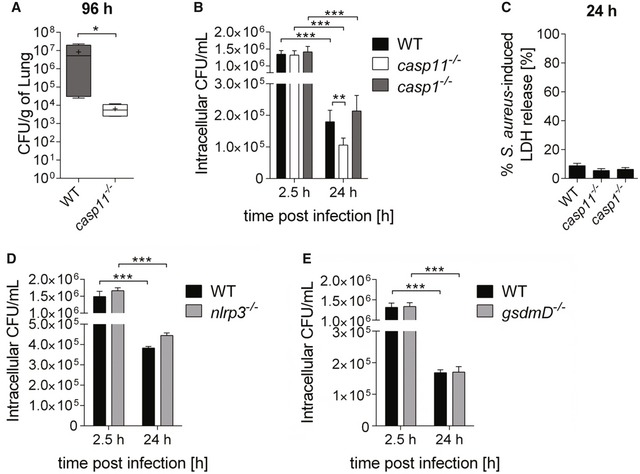
Figure 3. CASP11 deficiency promotes MRSA clearance in vitro and in vivo .

- In vivo CFUs from lungs of WT and casp11 −/− mice intratracheally infected with MRSA (2.5 × 10⁸ CFUs/mouse) at 96 h post‐infection (n = 4 biological replicates). Boxplot with whiskers from minimum to maximum. Horizontal bands represent the median, and “+” represents the mean. Statistical analysis was performed using two‐tailed Student's t‐test. *P ≤ 0.05.
- Intracellular survival of MRSA in WT, casp11 −/−, and casp1 −/− BMDMs (MOI 5:1). Data represent mean ± SEM (n = 12 biological replicates). Statistical analysis was performed using a linear mixed effects model. **P ≤ 0.01, ***P ≤ 0.001.
- MRSA‐induced LDH release in supernatants from WT, casp11 −/−, and casp1 −/− BMDMs (MOI 5:1) at 24 h post‐infection. Data represent mean ± SEM (n = 6 biological replicates). Statistical analysis was performed using one‐way ANOVA.
- Intracellular survival of MRSA in WT and nlrp3 −/− BMDMs (MOI 5:1). Data represent mean ± SEM (n = 3 biological replicates). Statistical analysis was performed using a linear mixed effects model. ***P ≤ 0.001.
- Intracellular survival of MRSA in WT and gsdmd −/− BMDMs (MOI 5:1). Data represent mean ± SEM (n = 6 biological replicates). Statistical analysis was performed using a linear mixed effects model. ***P ≤ 0.001.
