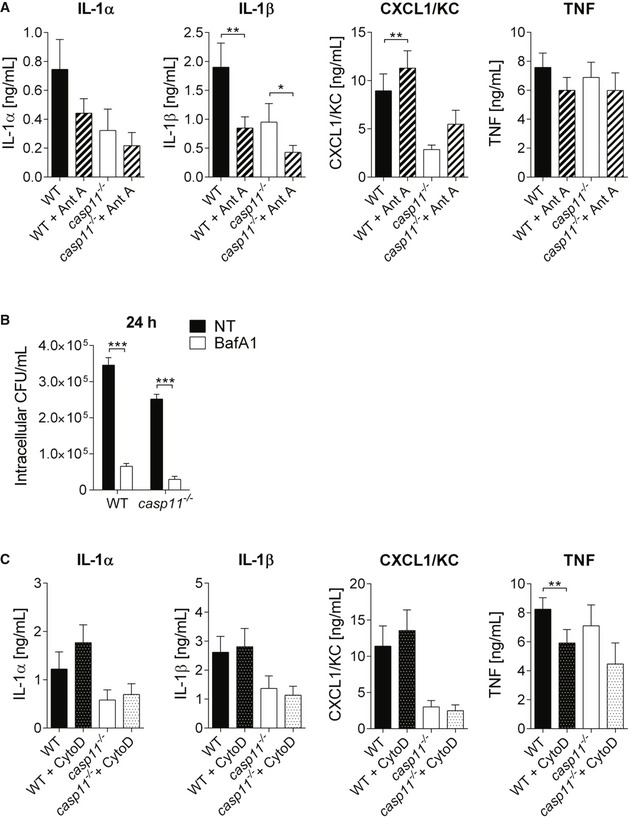
Figure EV3. Effects of Ant A, Baf A1, and Cyto D during MRSA infection in macrophages.

- Cytokine release from MRSA‐infected WT and casp11 −/− macrophages treated with Ant A at 24 h post‐infection (MOI 20:1). Data represent mean ± SEM (n = 8 biological replicates). Statistical analysis was performed using one‐way ANOVA. *P ≤ 0.05, **P ≤ 0.01.
- Intracellular CFU of MRSA in WT and casp11 −/− macrophages treated with BafA1 at 24 h post‐infection (MOI 5:1). Data represent mean ± SEM (n = 3 biological replicates). Statistical analysis was performed using two‐way ANOVA. ***P ≤ 0.001, NT = no treatment.
- Cytokine release from MRSA‐infected WT and casp11 −/− macrophages treated with Cyto D at 24 h post‐infection (MOI 20:1). Data represent mean ± SEM (n = 6 biological replicates). Statistical analysis was performed using one‐way ANOVA. **P ≤ 0.01.
