-
A
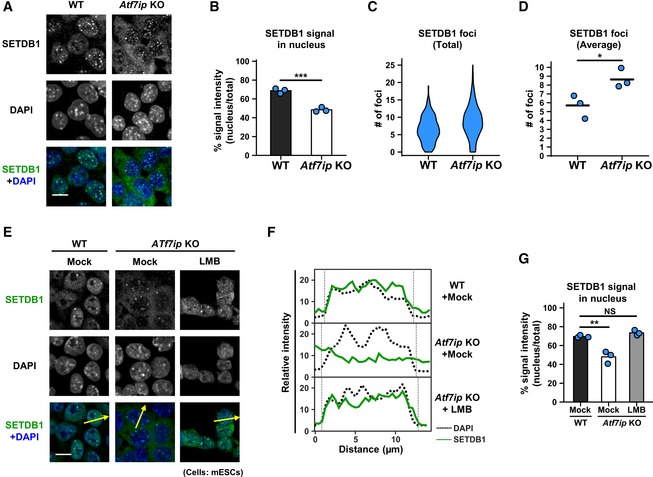
IF analysis shows preferential cytoplasmic localization of SETDB1 in Atf7ip KO mESCs. Representative projected images are shown, and the quantitative analyses are shown in (B–D). Scale bar: 10 μm.
-
B
SETDB1 signal in the nucleus that was determined by DAPI staining was calculated. The mean from three independent experiments is shown as a bar graph with jittered points indicating the average % intensity of each experiment. Over 100 cells were analyzed per sample per experiment. ***P < 0.001 by unpaired Student's t‐test.
-
C, D
SETDB1 foci in the nucleus that was determined by DAPI staining were calculated. Violin plot for SETDB1's foci numbers from all the cells analyzed in three independent experiments is shown in (C). The mean from the three independent experiments is shown as a bar with jittered points indicating the average number of each experiment in (D). Over 100 cells were analyzed per sample per experiment. *P < 0.05 by unpaired Student's t‐test.
-
E
IF analysis shows preferential cytoplasmic localization of SETDB1 in Atf7ip KO mESCs. Representative projected images are shown. Arrows indicate the region used for line‐plot analysis. Cells were treated with 10 ng/ml LMB or mock for 5 h before analysis. Scale bar: 10 μm.
-
F
The line‐plot analysis for (E). Relative intensities of SETDB1 signal were measured by ImageJ.
-
G
The quantitative analysis for (E) is shown. SETDB1 signal in the nucleus that was determined by DAPI staining was calculated. The mean from three independent experiments is shown as a bar graph with jittered points indicating the average % intensity of each experiment. Over 100 cells were analyzed per sample per experiment. NS: P > 0.05, **P < 0.01 vs. “Mock, WT” group by Dunnett's test.

