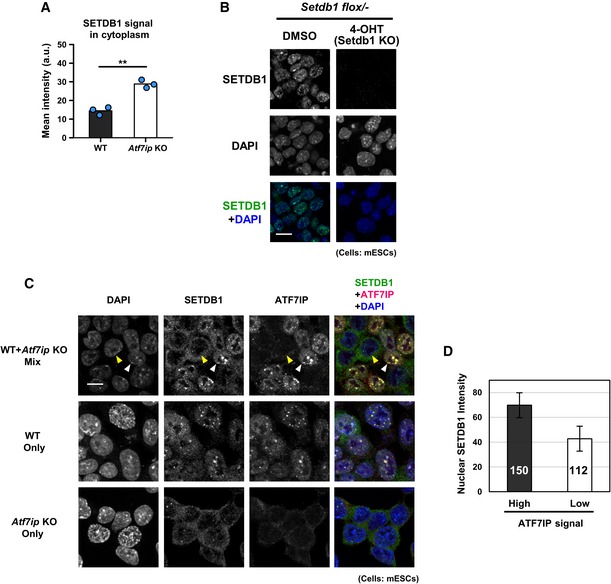
Figure EV2. Reduction of nuclear SETDB1 in Atf7ip KO mESCs (related to Fig 2).

-
ASETDB1 signal in the cytoplasm that is shown in Fig 2A was calculated. The mean from three independent experiments is shown as a bar graph with jittered points indicating the average % intensity of each experiment. Over 100 cells were analyzed per sample per experiment. **P < 0.001 by unpaired Student's t‐test.
-
BValidation of anti‐SETDB1 antibody used in this study by IF analysis. Conditional Setdb1 KO mESCs show no signal after 4‐OHT treatment to deplete SETDB1. Scale bar: 7.33 μm.
-
CImmunostaining of ATF7IP as shown in Fig 2A was conducted using a mixture of WT and Atf7ip KO mESCs (1:1) (top) in addition to WT (middle) or Atf7ip KO (bottom) alone. The yellow and white arrowhead indicates AFP7IP signal high and low cell which are supposedly WT and Atf7ip KO cell, respectively. Scale bar: 10 μm.
-
DSETDB1 signal in the nucleus of ATF7IP high and low cells as shown in (C) top panel was calculated. The mean with SD is shown as a bar graph. Over 100 of each cell type (150 and 112 for ATF7IP high and low cells, respectively) was analyzed. Error bars: SD.
