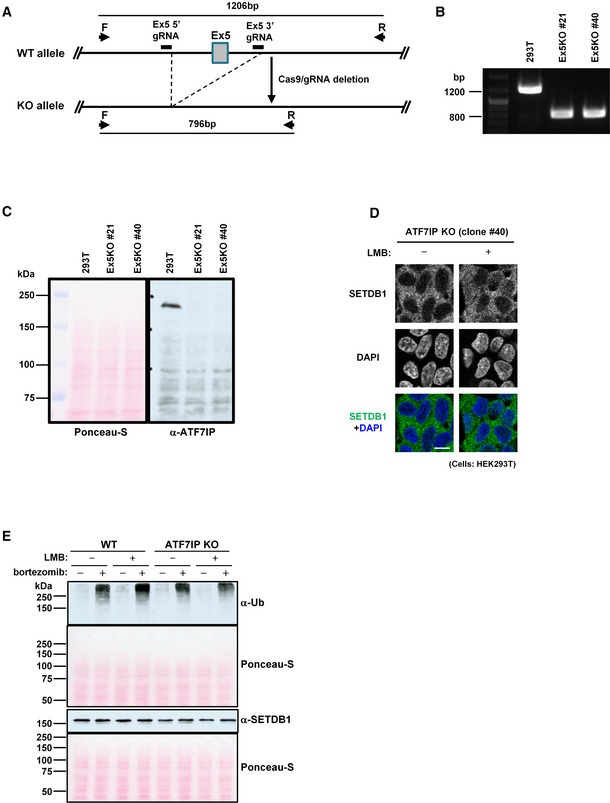
Figure EV3. Establishment and characterization of ATF7IP KO HEK293T cells (related to Fig 3).

-
AATF7IP KO strategy by the CRISPR/Cas9 system. If Exon 5(Ex5) of ATF7IP is deleted between the 5′ and 3′ gRNA target sequences, PCR with primer F and R amplifies about 800‐bp DNA fragment from the KO allele vs. 1,200 bp from WT allele.
-
BPCR validation result of two independent ATF7IP KO HEK293T cell clones, #21 and #40.
-
CConfirmation of no ATF7IP protein expression in two ATF7IP KO HEK293T cell clones, #21 and #40. Ponceau‐S staining of same blotted membrane used for ATF7IP detection. The representative data of two independent experiments are shown.
-
DSETDB1 cellular localization in another ATF7IP KO HEK239T cell clone, #40 without or with LMB treatment for 5 h. The representative data of multiple independent experiments are shown. Scale bar: 10 μm.
-
EImpact of bortezomib treatment on cellular protein stability. Same number of WT or ATF7IP KO HEK293T cells was aliquoted into the 1.5‐ml tubes and untreated or treated with LMB (10 ng/ml) or/and bortezomib (100 nM) for 5 h before analysis which is same condition as used for Fig 3E. Ponceau‐S staining of same blotted membrane used for poly‐Ub and SETDB1 detection, respectively. The representative data of two independent experiments are shown.
Source data are available online for this figure.
