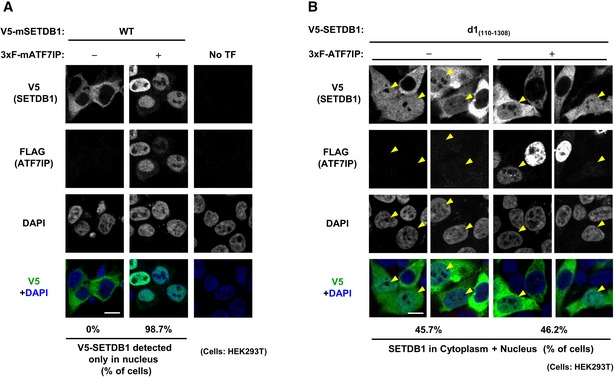
Figure 4. N‐terminal region of SETDB1 contributes to its cellular localization.

-
AHEK293T cells were transfected with V5‐SETDB1 and either empty or 3xF‐ATF7IP expressing vector. Over 50 transfected cells analyzed per sample were analyzed. The representative data of two independent experiments are shown. Scale bar: 10 μm.
-
BHEK293T cells were transfected with V5‐SETDB1 d1 mutant and either empty or 3xF‐ATF7IP expressing vector. Over 50 transfected cells per sample were analyzed. The representative data of two independent experiments were shown. Scale bar: 10 μm. The yellow arrowheads indicate the cells that show nuclear (and cytoplasmic)‐localization of introduced exogenous mSETDB1.
