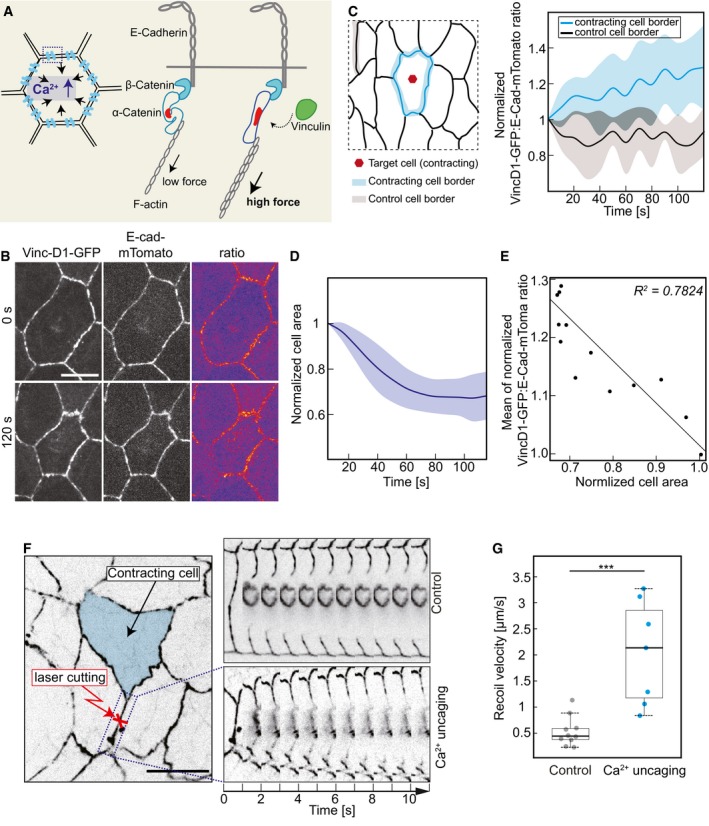
Schematic drawing of force‐dependent Vinculin association to adherens junctions and principle of the Vinculin reporter.
Images from time‐lapse recording of an amnioserosa cell after CaLM in embryos (stage 14) expressing E‐Cad‐mTomato and VinculinD1‐GFP.
Ratio of VinculinD1‐GFP and E‐Cadherin‐mTomato fluorescence at the junctions of the target contracting cells (blue) and control cells (black) The ratio was normalized to initial ratio (the first frame of recording after uncaging). Mean (bold line) with standard deviation of the mean (ribbon band) (n = 6 constricting cells and nine inactive cell borders in six embryos), P = 0.033 at 60 s (CE50), P = 0.011 at 120 s (two‐tailed unpaired t‐test).
Cross‐sectional area in target cells normalized to initial size (the first frame of recording after uncaging). Mean (bold line) with standard deviation of the mean (ribbon band) (n = 6 cells in six embryos).
Scatter plot of normalized area of target cells with the mean of VinculinD1/E‐Cadherin ratio at the cell junctions (n = 6 cells in six embryos).
The schematic of amnioserosa shows the first neighbor junction of CaLM target cells (indicated by red cross). Kymographs show recoil after junction ablation. Control ablations were conducted in the embryos injected with buffer without NP‐EGTA, AM, and the junctions were selected randomly.
Boxplot shows the initial recoil velocity after laser ablation. Bold horizontal line, mean. Box, second and third quartile. Black horizontal dash line with whisker, 95% bootstrap confidence intervals. ***P = 0.00035151 (two‐tailed unpaired t‐test). Dots indicate the individual recoil velocity. Control, n = 10 junctions in four embryos. Ca2+ uncaging, n = 7 junctions in seven embryos.
Data information: Scale bars: 10 μm in (B, F).

